TradingView indicators · Trade automation · Research · Swing Desk
Sharper tools for Futures and Options.
On mobile, tap and hold the chart for a few seconds to get the cursor.
Charts are past examples shown to illustrate how each tool looks on TradingView. Not signals, recommendations or a record of results.
Options flow · Indian and US markets
HFT Algo Scanner
Follows options flow in real time to show where the big money is positioned, built for traders who watch for reversals.
HFT Algo Scanner · best features
- 01
Four flows, one pane.
Call buying, call writing, put buying and put writing, as coloured columns right under the chart.
- 02
Several strikes at once.
It reads options activity across the strikes around the price, not just a single one.
- 03
Labels with a strength.
Buy and Sell labels carry a strength reading, and only show above the minimum you set.
- 04
The Fund Flow table.
Totals for recent candles, the session and the day, on the chart itself.
- 05
One alert for everything.
A single alert covers all four flows, by email, mobile, desktop or webhook.






1 / 16
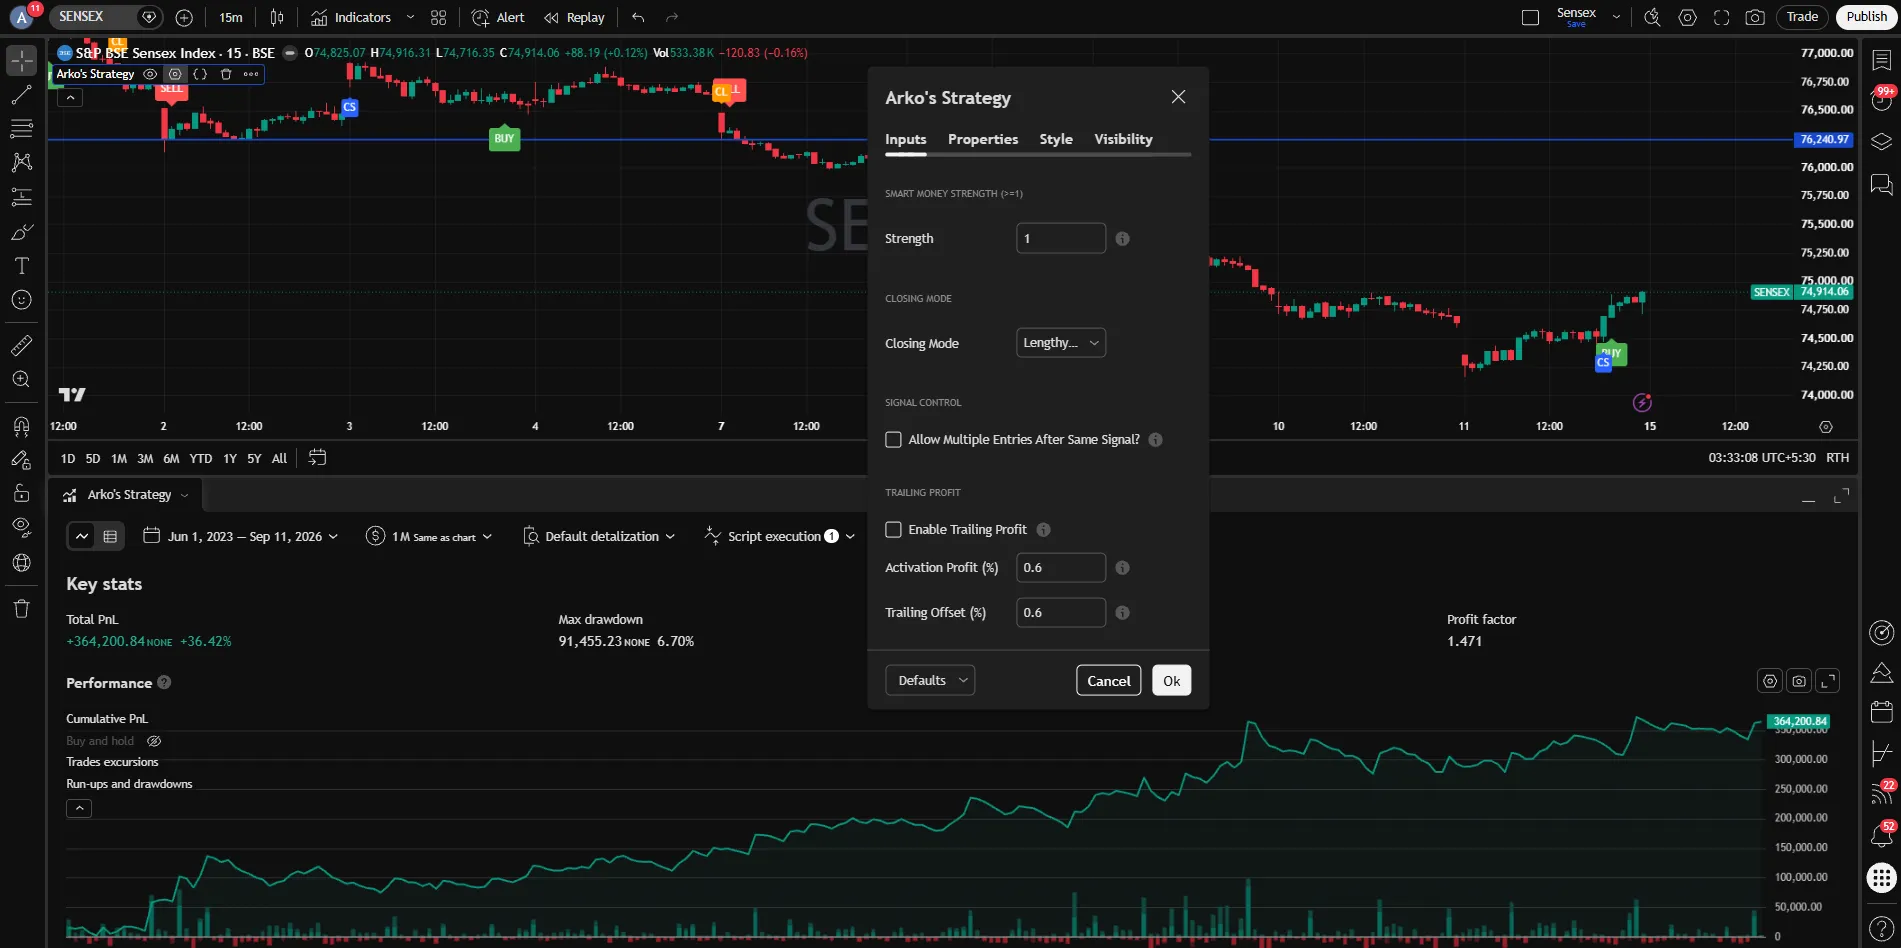
Screenshots from TradingView, as TradingView showed them. Strategy Tester figures are backtests on past data for the period shown, not a forecast or a record of real trades. Settings differ by market and timeframe.
TradingView strategy · Any chart
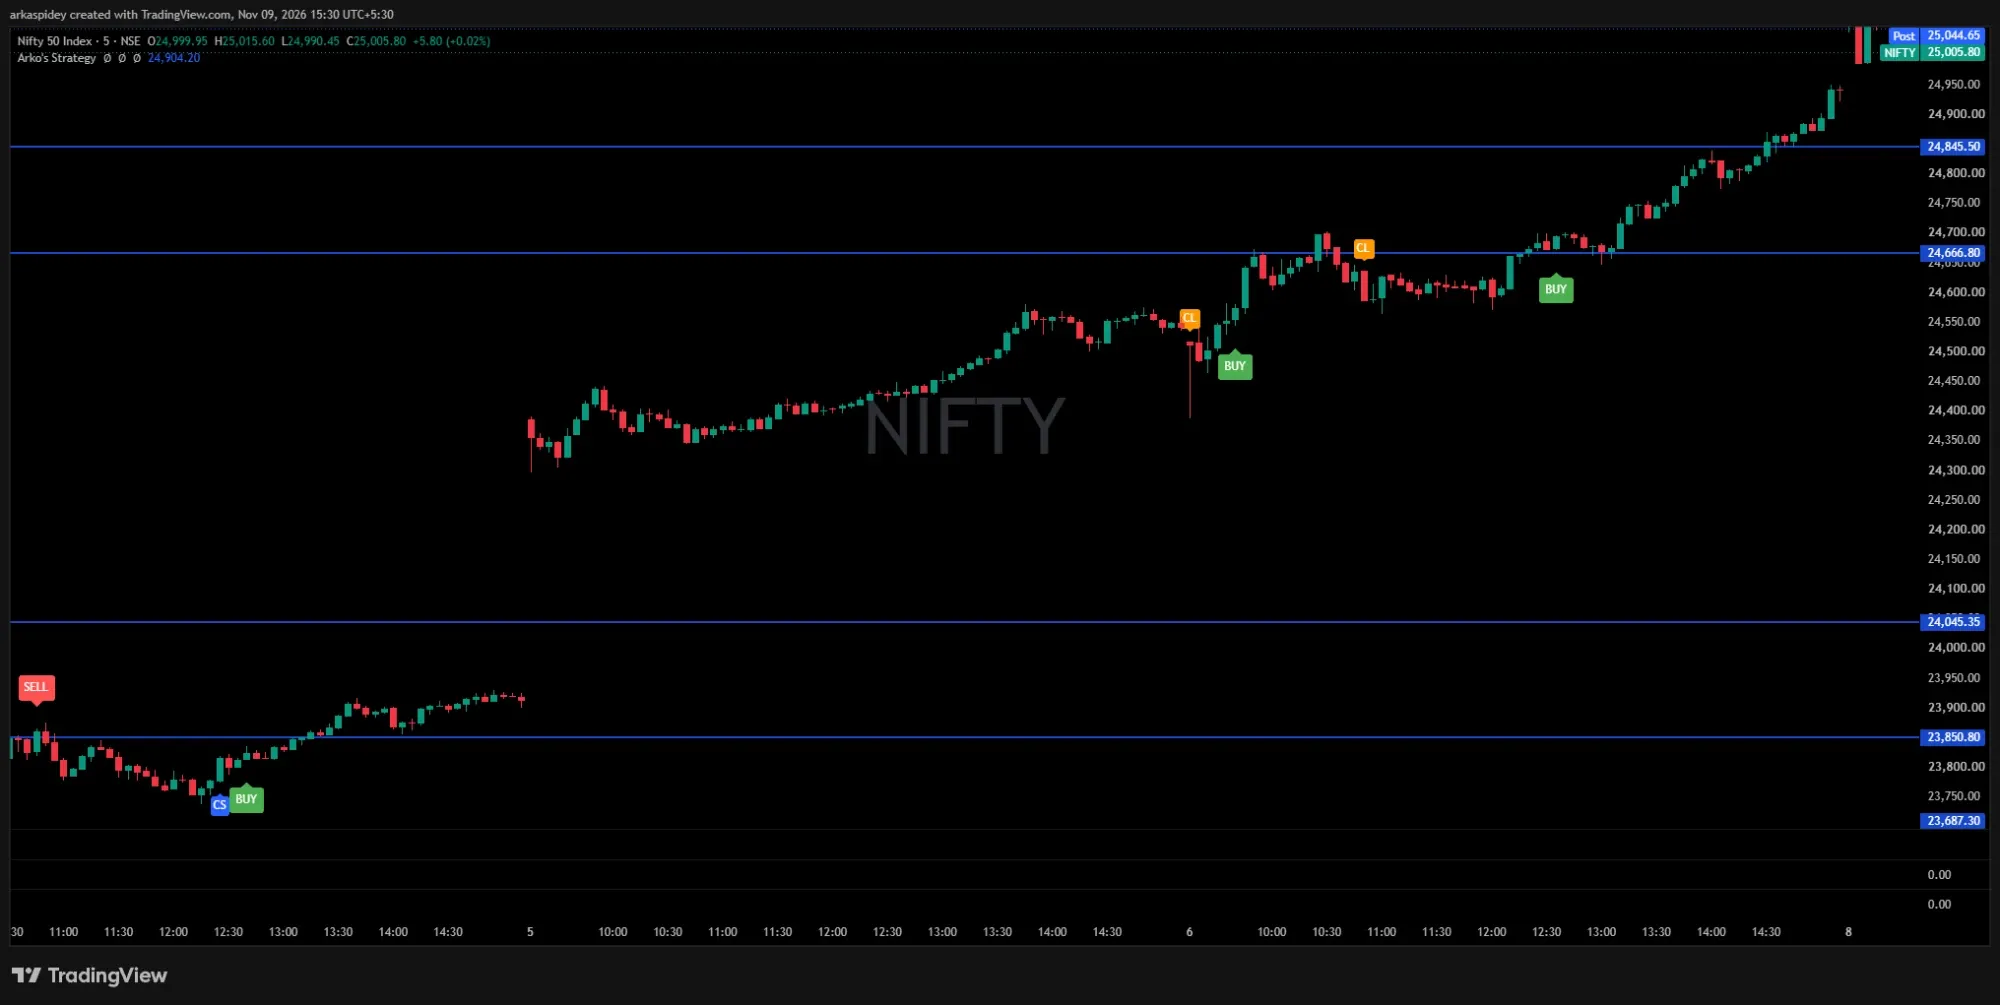
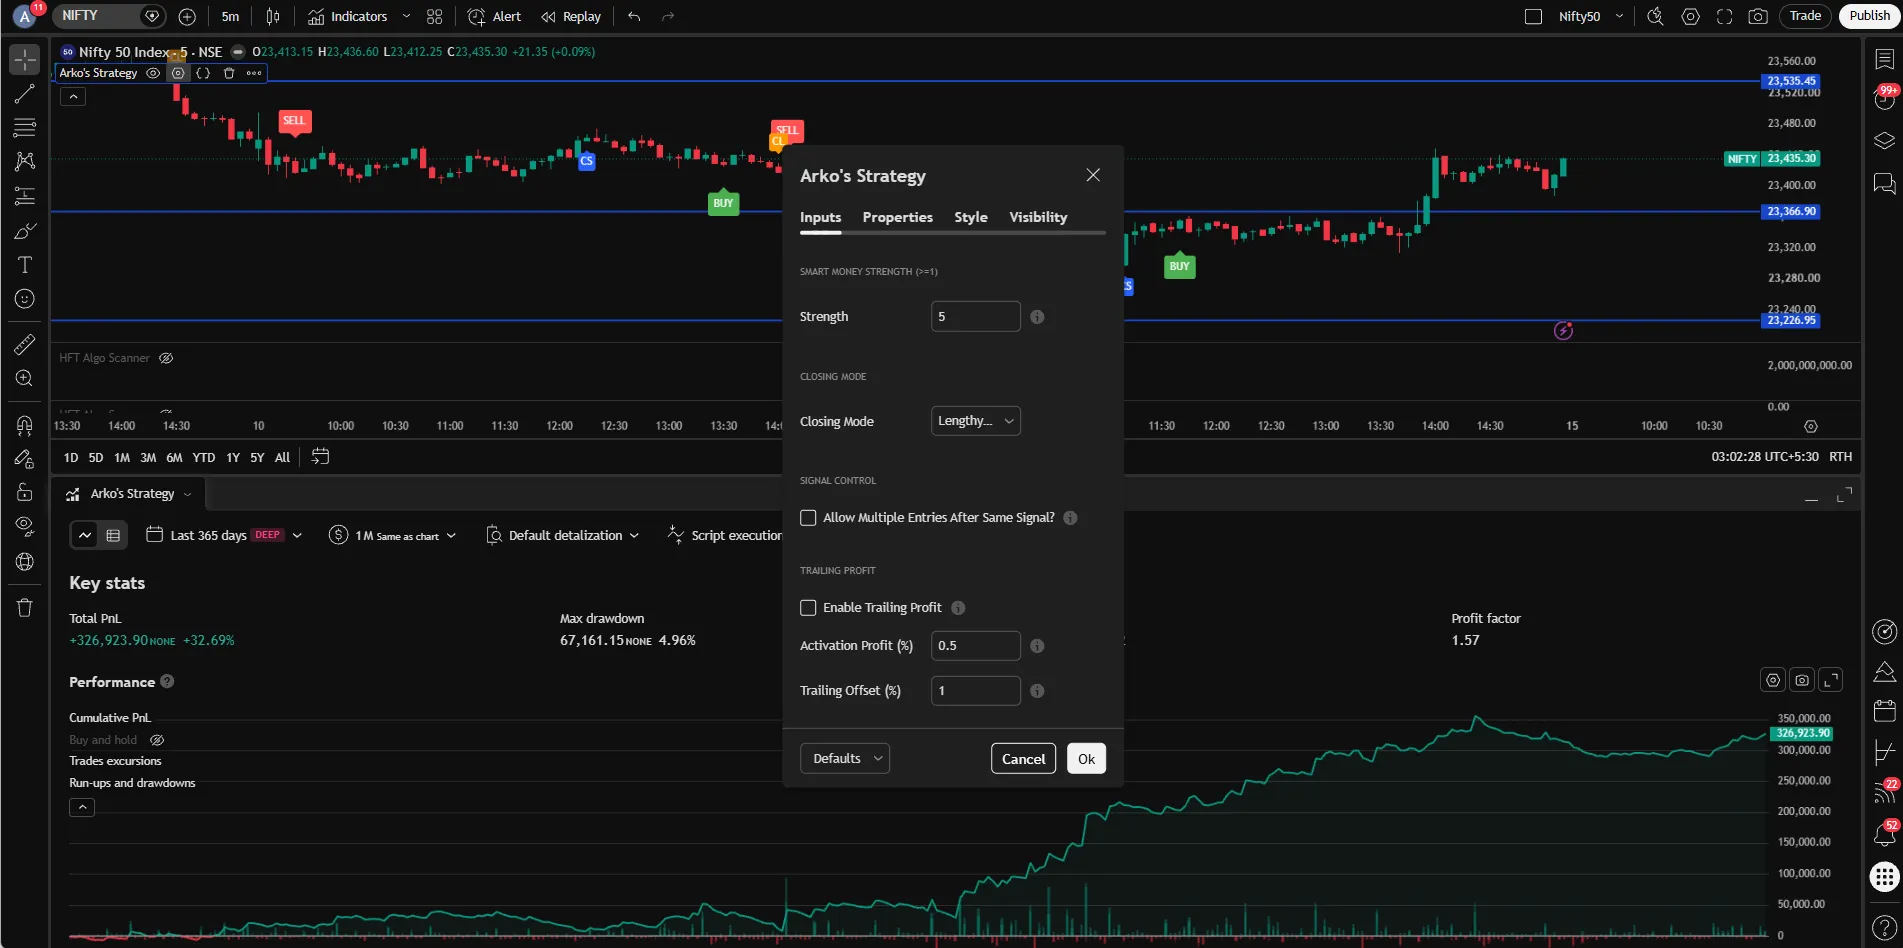
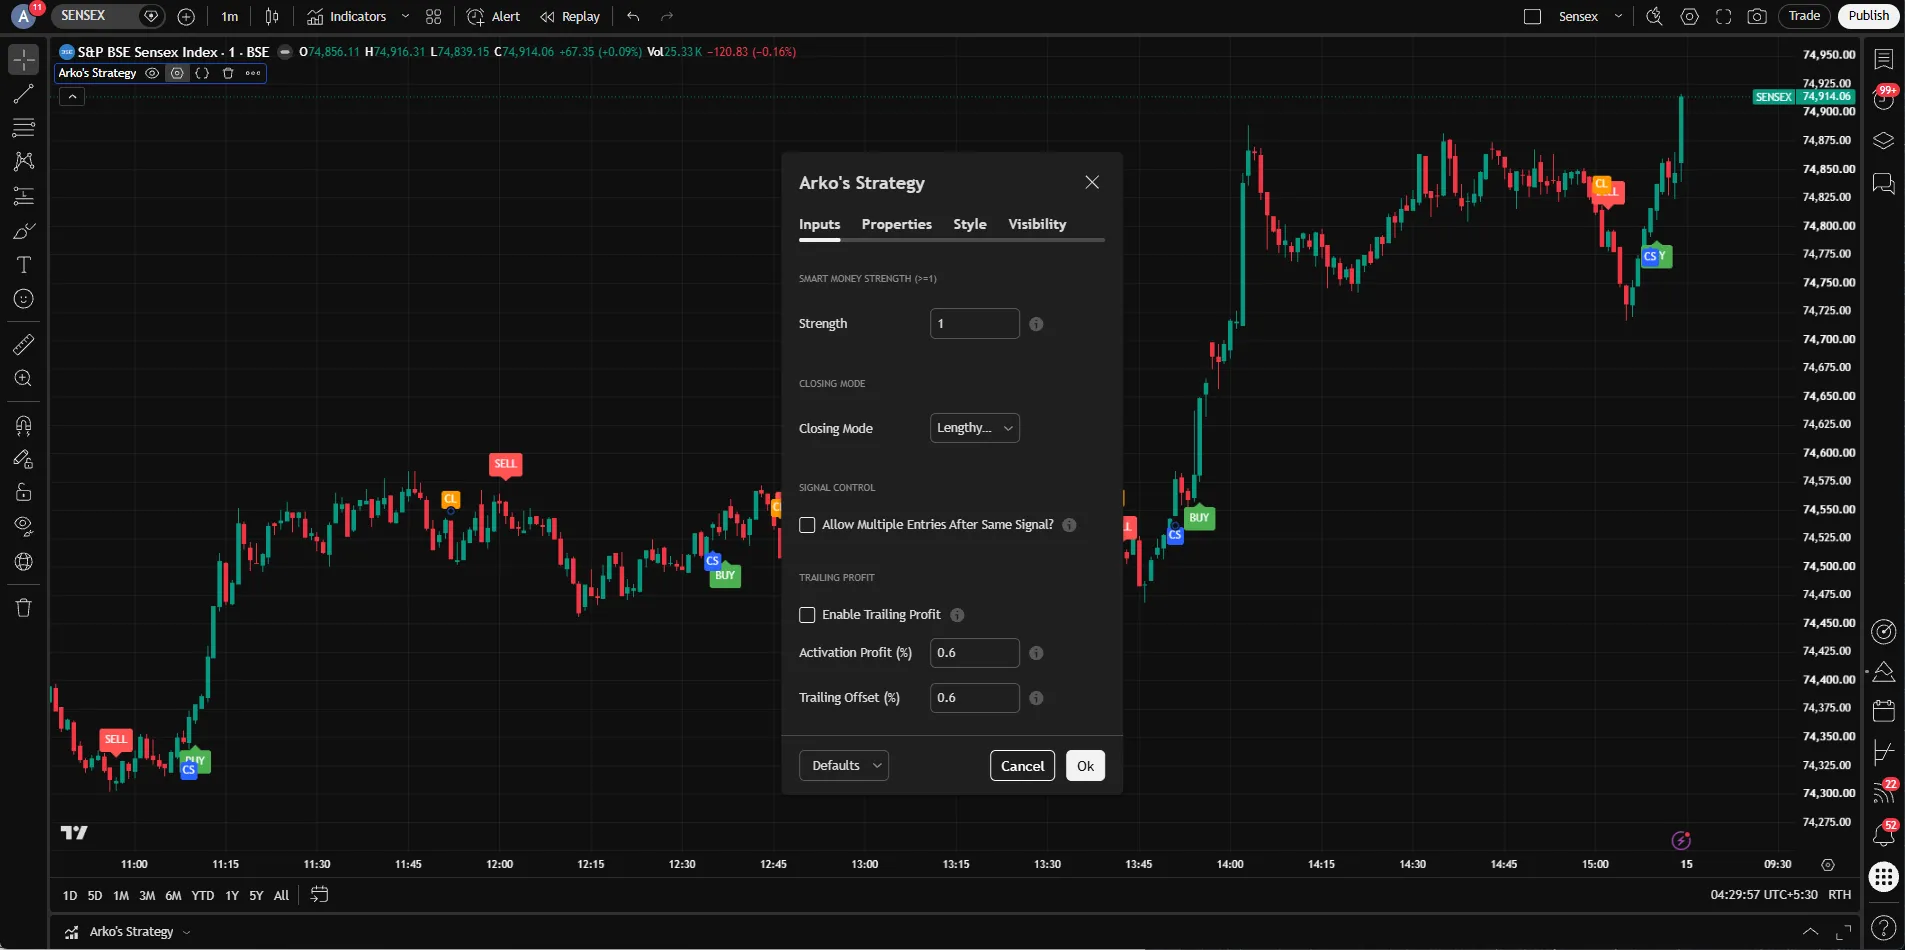
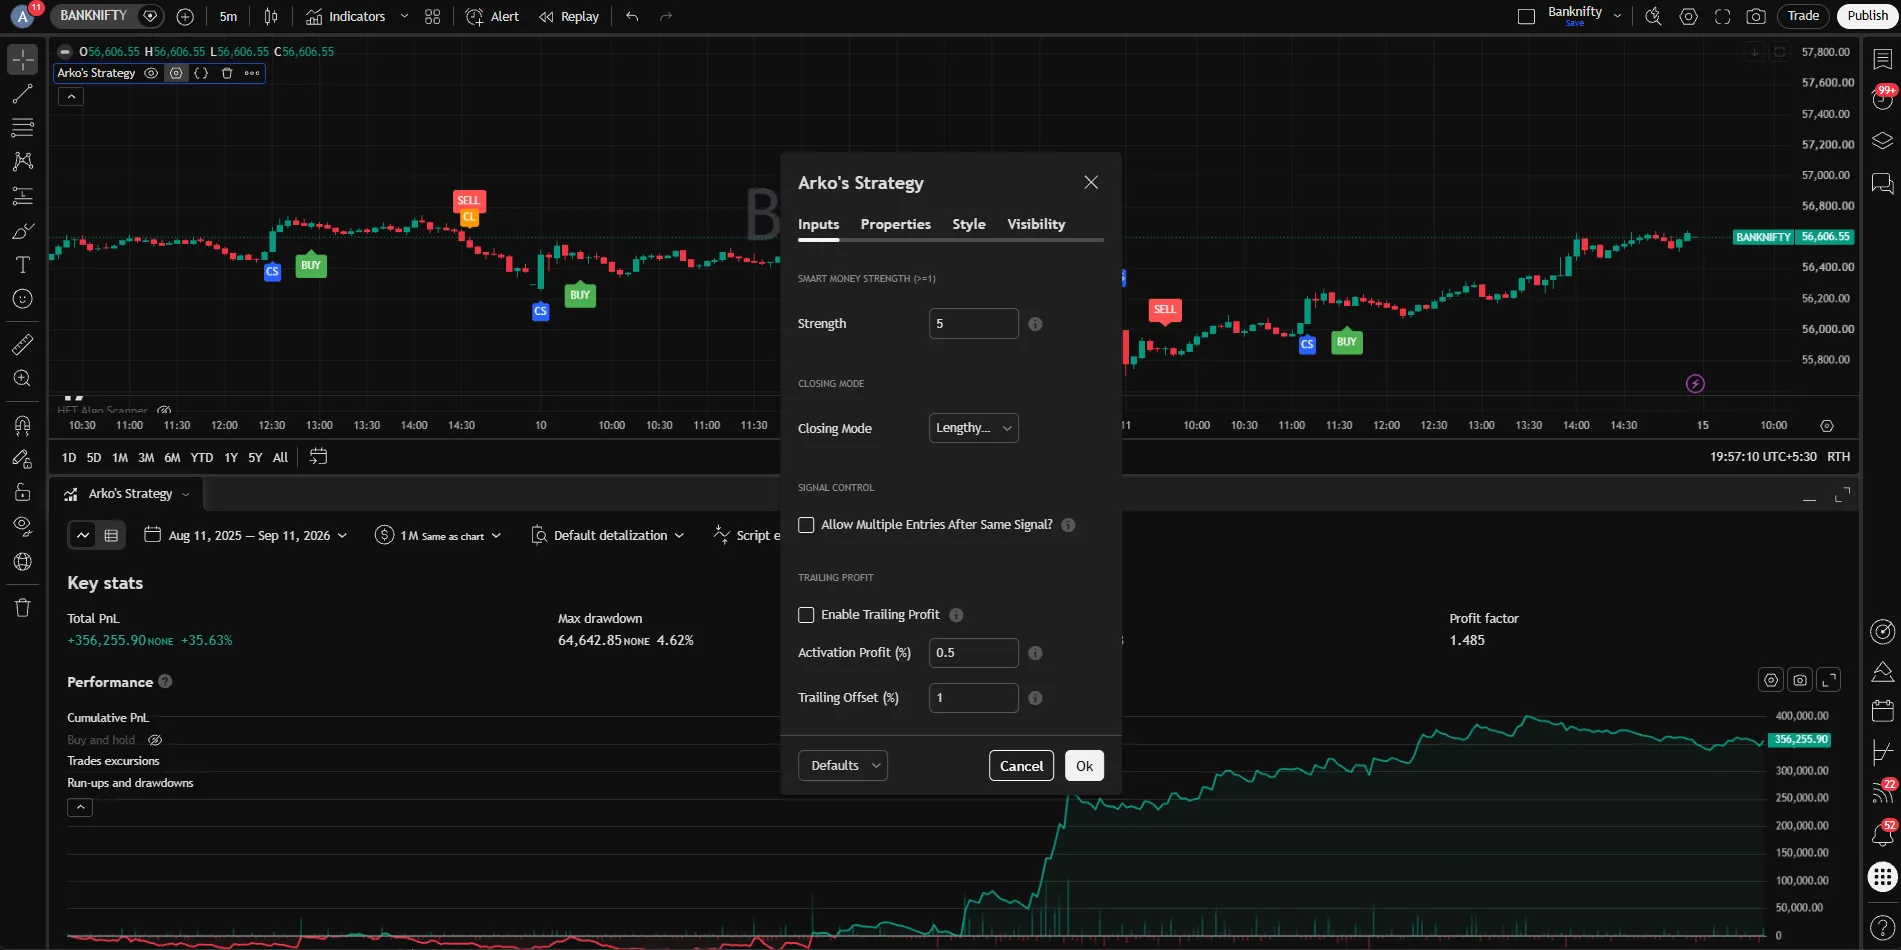
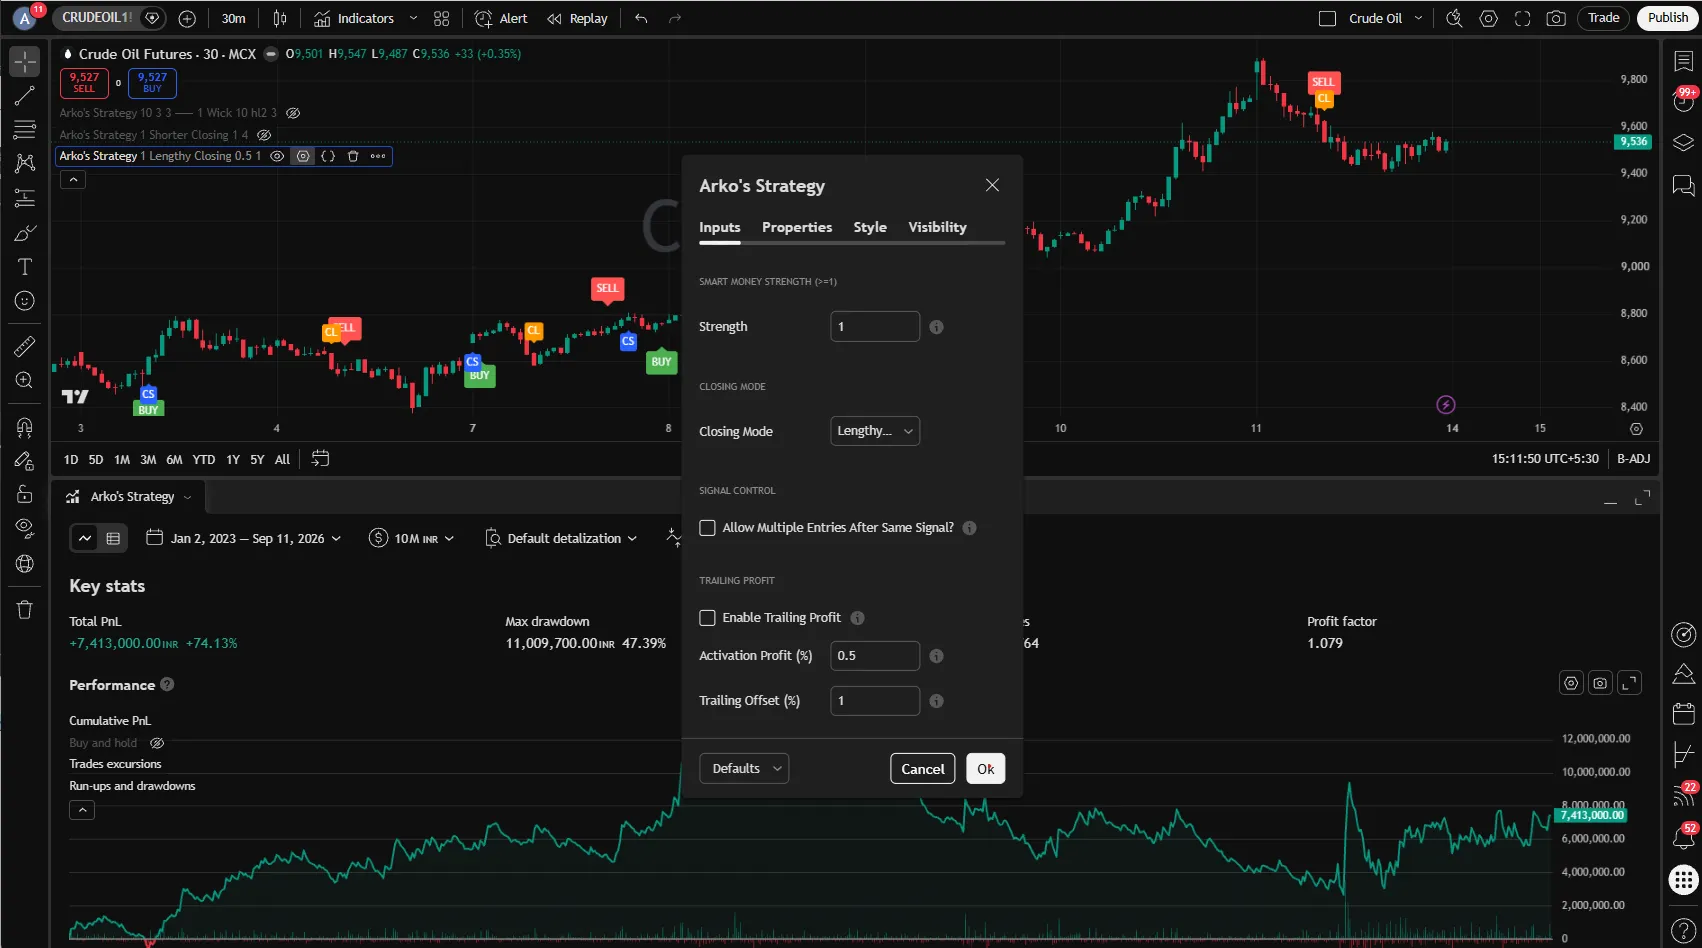
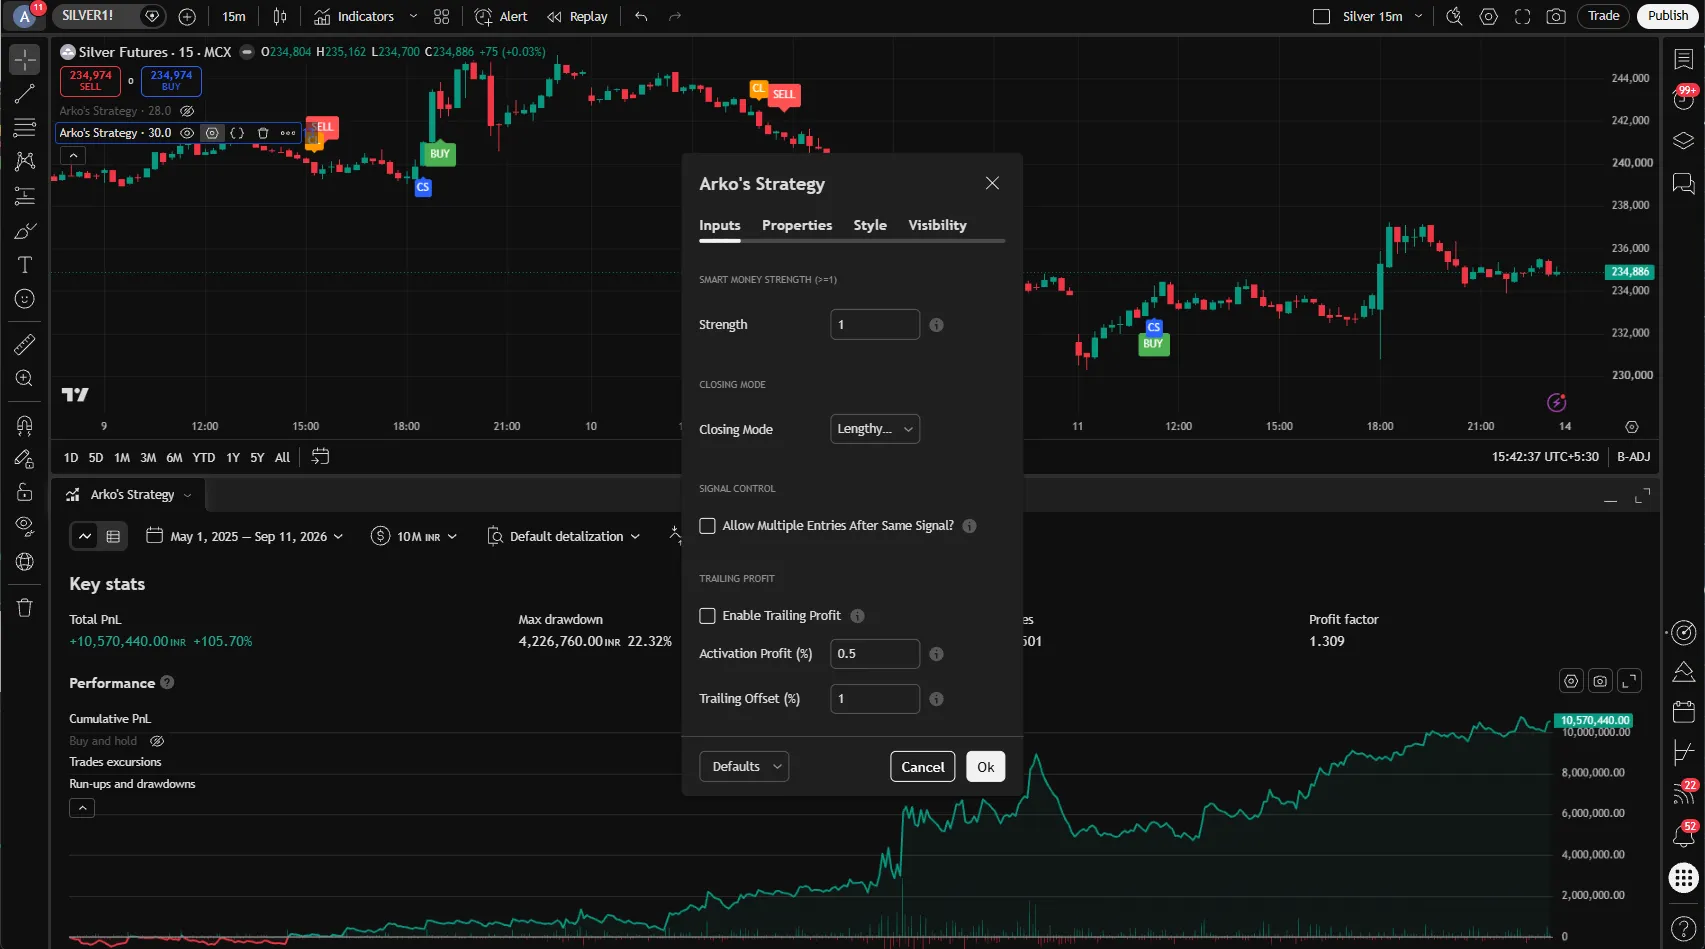
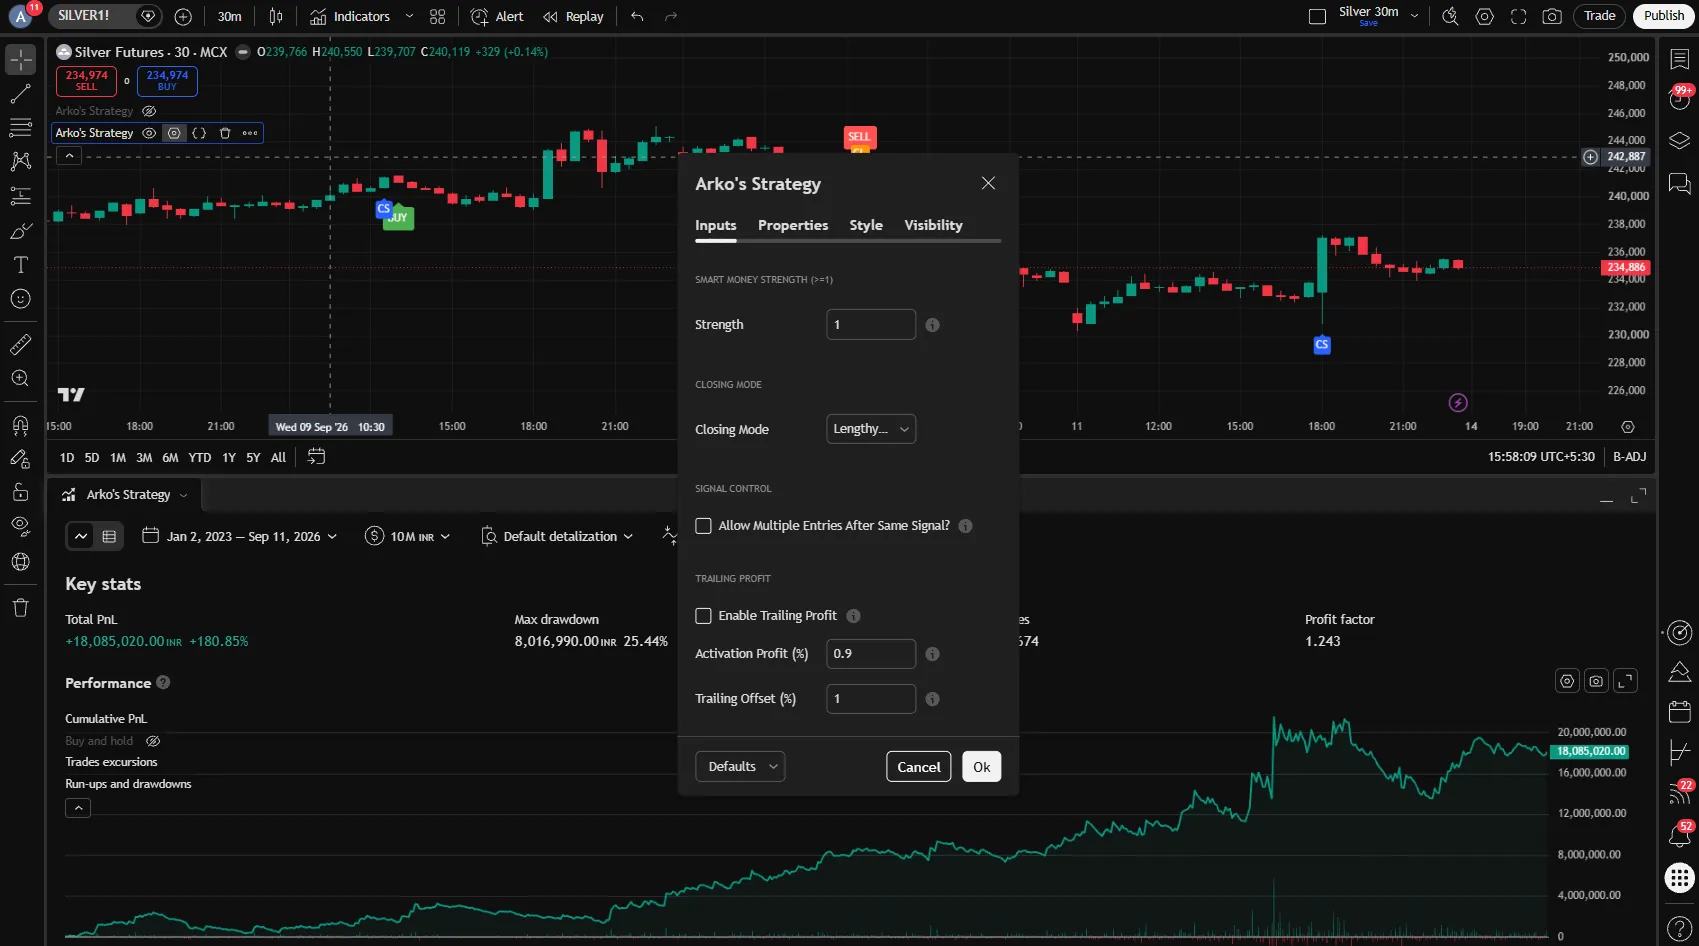
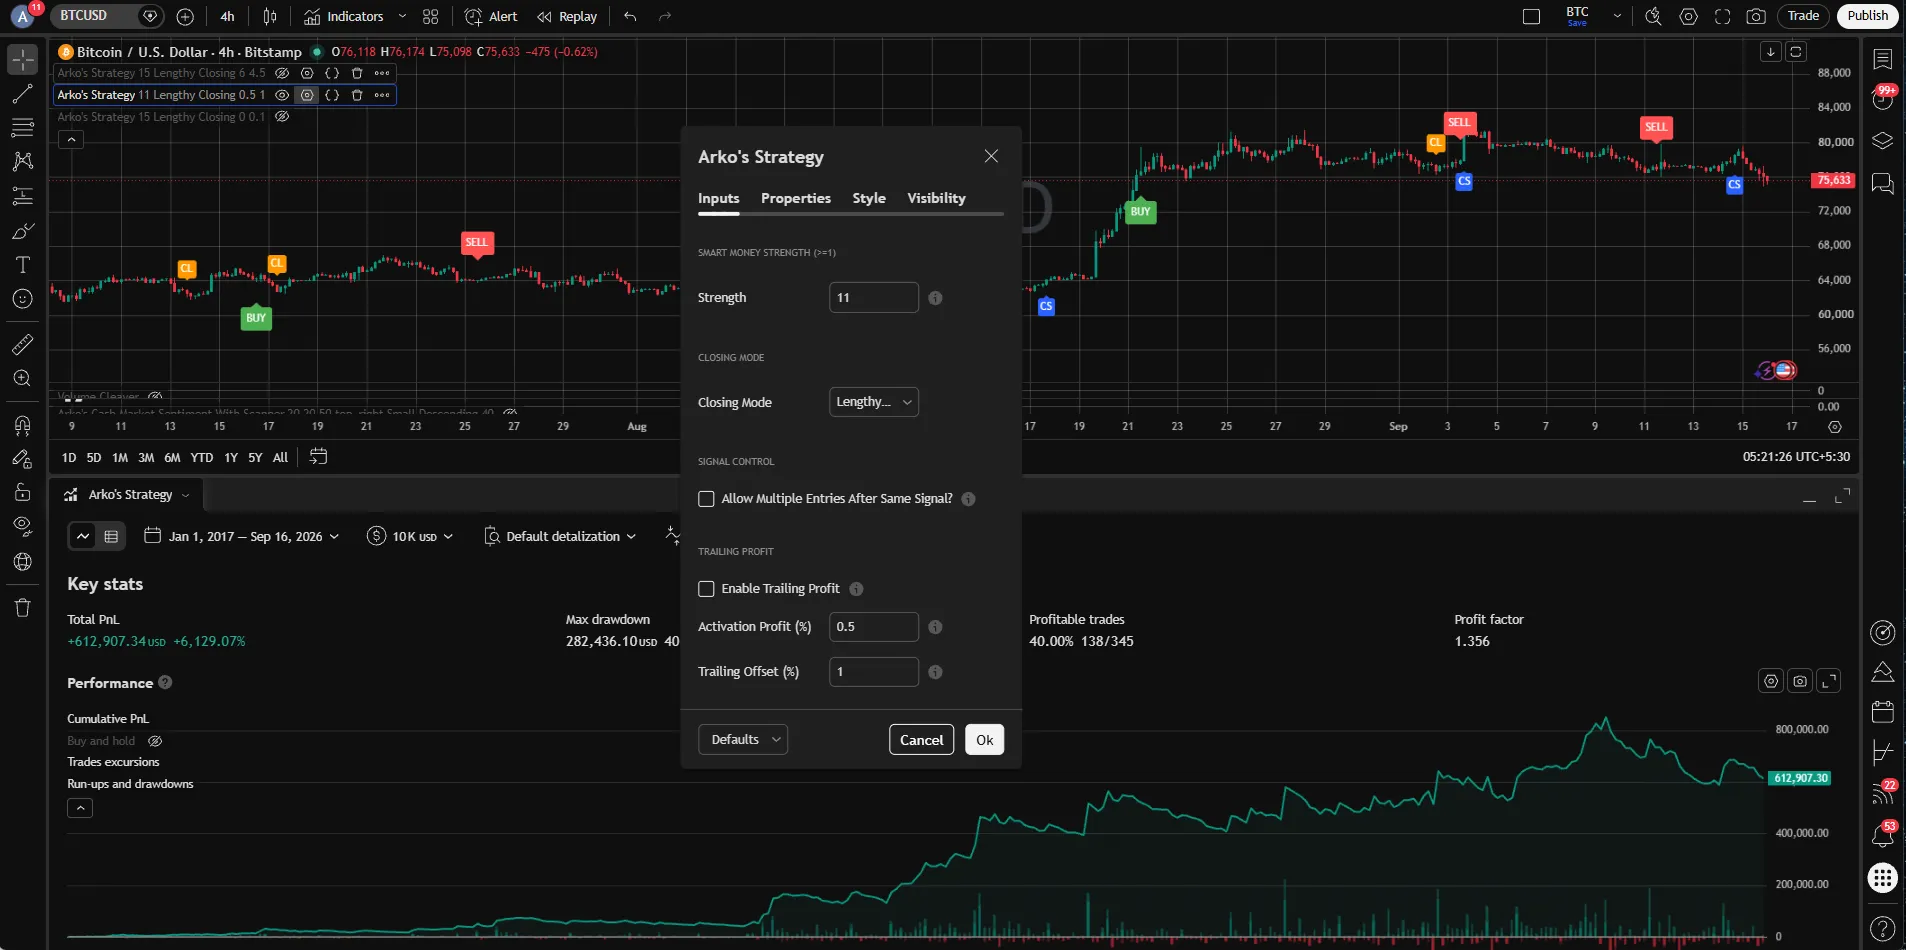
Arko's Strategy
A TradingView strategy built for automating your trades: its alerts can go directly to your own broker, or through Vyuh.
Arko's Strategy · best features
- 01
Automate trades from any chart.
Trade Indian indices and stocks, MCX commodities, crypto and US markets. It works on almost any chart.
- 02
Four clear markers.
Buy, Sell, Close Long and Close Short, drawn on your chart as the bars form.
- 03
Test it first.
It runs in TradingView's Strategy Tester, so you can study it trade by trade before you use it.
- 04
Set it once.
No need to keep changing the settings every session.
- 05
Ready to automate.
Its alerts can go directly to your own broker, or through Vyuh.
The Vyuh launch video, 2 min 23 s. Product scenes use demo data.
Software · Windows
Vyuh
Your rules, your broker. Vyuh turns alerts into orders at your own broker, and watches every exit for you.
Vyuh · best features
- 01
Any alert, any broker
TradingView, GoCharting and Chartink alerts, sent to 31 Indian brokers.
- 02
Strategies with every exit
Up to 10 legs, with stops, targets, trailing stops and profit locks.
- 03
Paper first
Live trading stays off until you switch it on, with a kill switch and loss limits.
- 04
Options tools
Option chain, Greeks, open interest flow and 42 strategy templates with payoffs.
- 05
Charts and scalping
Up to 16 live charts and one click scalping with the stop on the ticket.
- 06
Your code, your AI
Python strategies and AI assistants, with every order waiting for your approval.
The Swing Desk video, 40 s. Screens are from the build in progress, using NSE data to the close of 6 Nov 2026. Not a view on any index or stock.
NSE stocks · In development · work in progress
Swing Desk
A research desk for swing and position trades in Indian stocks. It brings the market, the sectors and each stock's story into one place, with AI help being added, so you can study a stock before you decide.
Swing Desk · best features
- 01
Fresh every evening
Updated from NSE's end of day files, once the day's F&O data is out.
- 02
80+ fields to screen by
Technical, swing, fundamental and F&O fields, with ready made scans or your own.
- 03
Where money is rotating
Sectors and industries ranked by breadth and strength, down to the stocks inside them.
- 04
Smart money and F&O
Bulk and block deals, insider trades and open interest build-up, in one place.
- 05
One page per stock
Chart, results, valuation, ownership and F&O history, with patterns marked.
- 06
AI help, in progress
AI to help you summarise and compare stocks is being added. You still make every call.
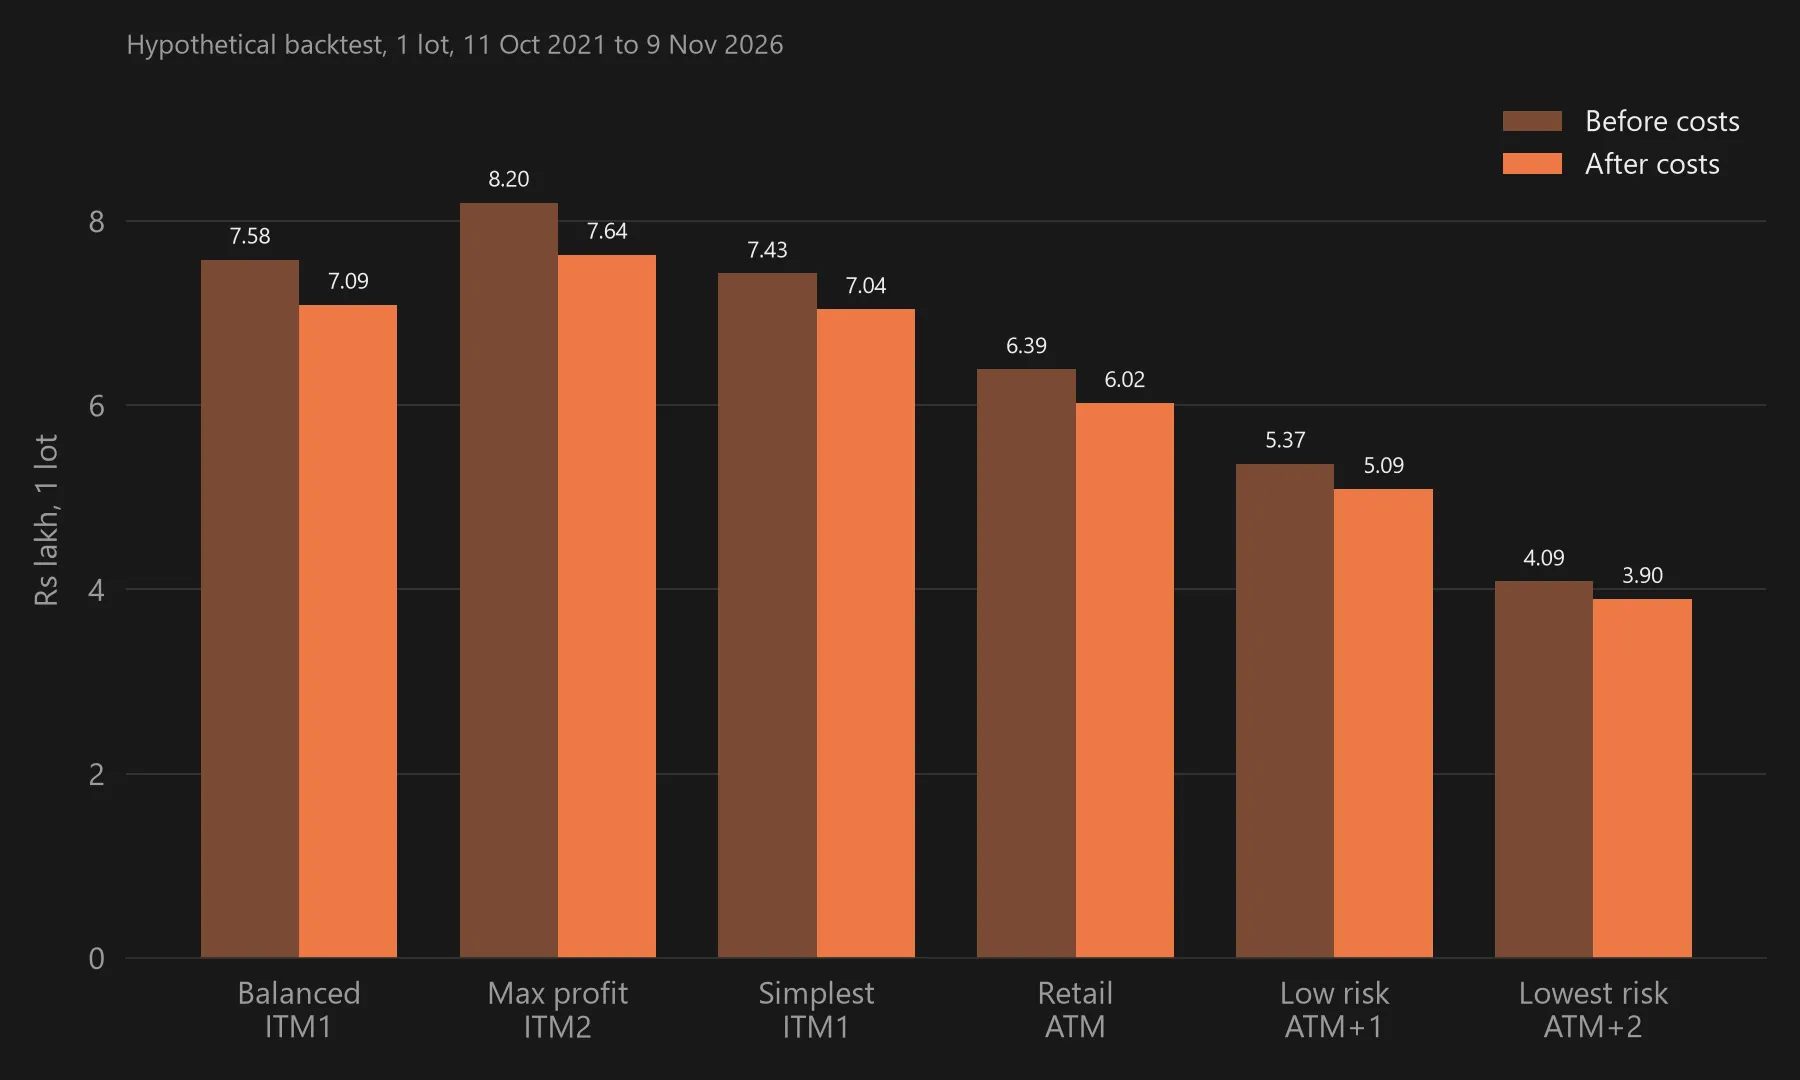
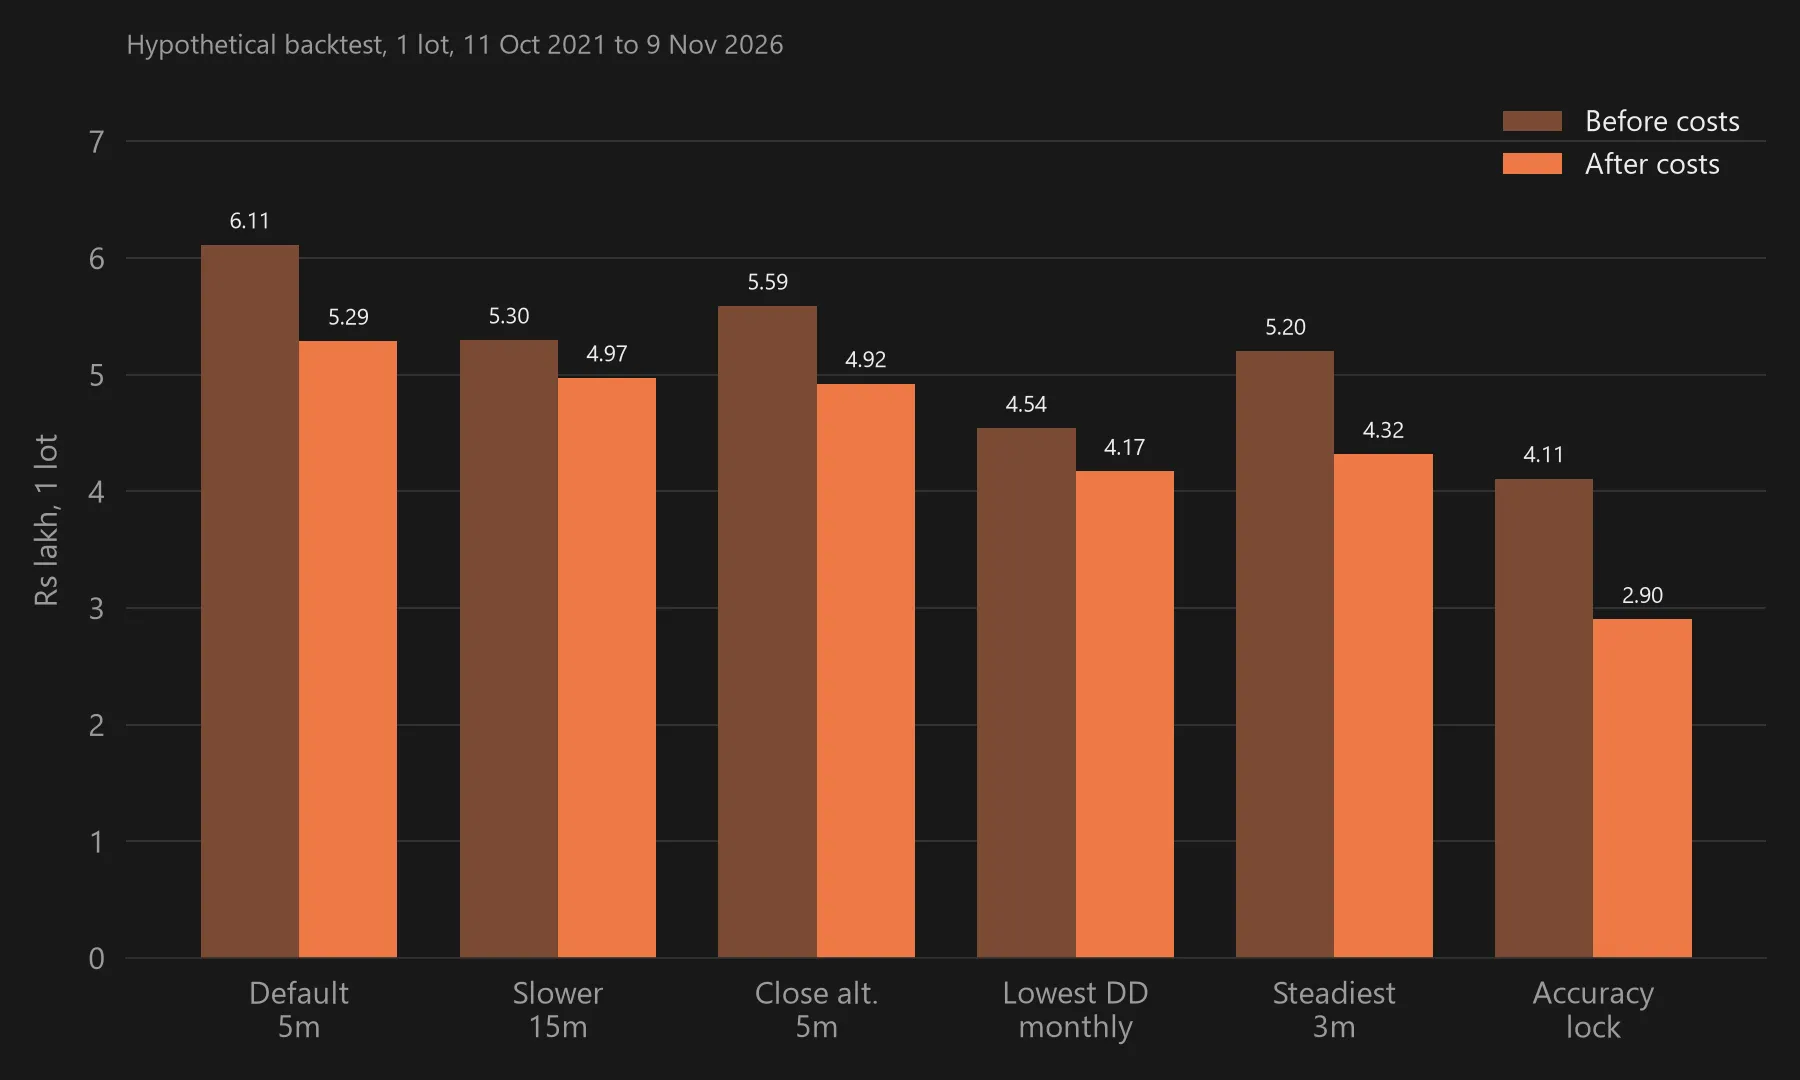
Hypothetical backtests on past data, 11 Oct 2021 to 9 Nov 2026, 1 lot, statutory costs, zero brokerage. Not a forecast, a recommendation or a record of real trades. Option trading can lose more than you expect.
Research · Arko's Strategy
Research desk
Large backtests of Arko's Strategy signals on Nifty options, published in full: every setting tested, what costs take, the drawdowns and the years that went badly.
Research desk · best features
- 01
64,000+ backtests
Over 30,000 on option selling and 34,000 on option buying, all on the same signals.
- 02
Costs on every trade
Statutory charges and slippage are applied to every trade, and the reports show what they take.
- 03
The bad years too
Every calendar year, the worst month and the deepest drawdown, not just the total.
- 04
What did not work
Exit rules that cut profit are listed next to the ones that helped.
- 05
More to follow
Sensex, Bank Nifty, F&O stocks and other indices are next, each in its own report.
Tools and indicators
TradingView · Strategy
Arko's Strategy
A TradingView strategy that marks entries and exits on your chart, so you can test an approach on past data and then follow it with alerts.
Read the guideTradingView · Indicator
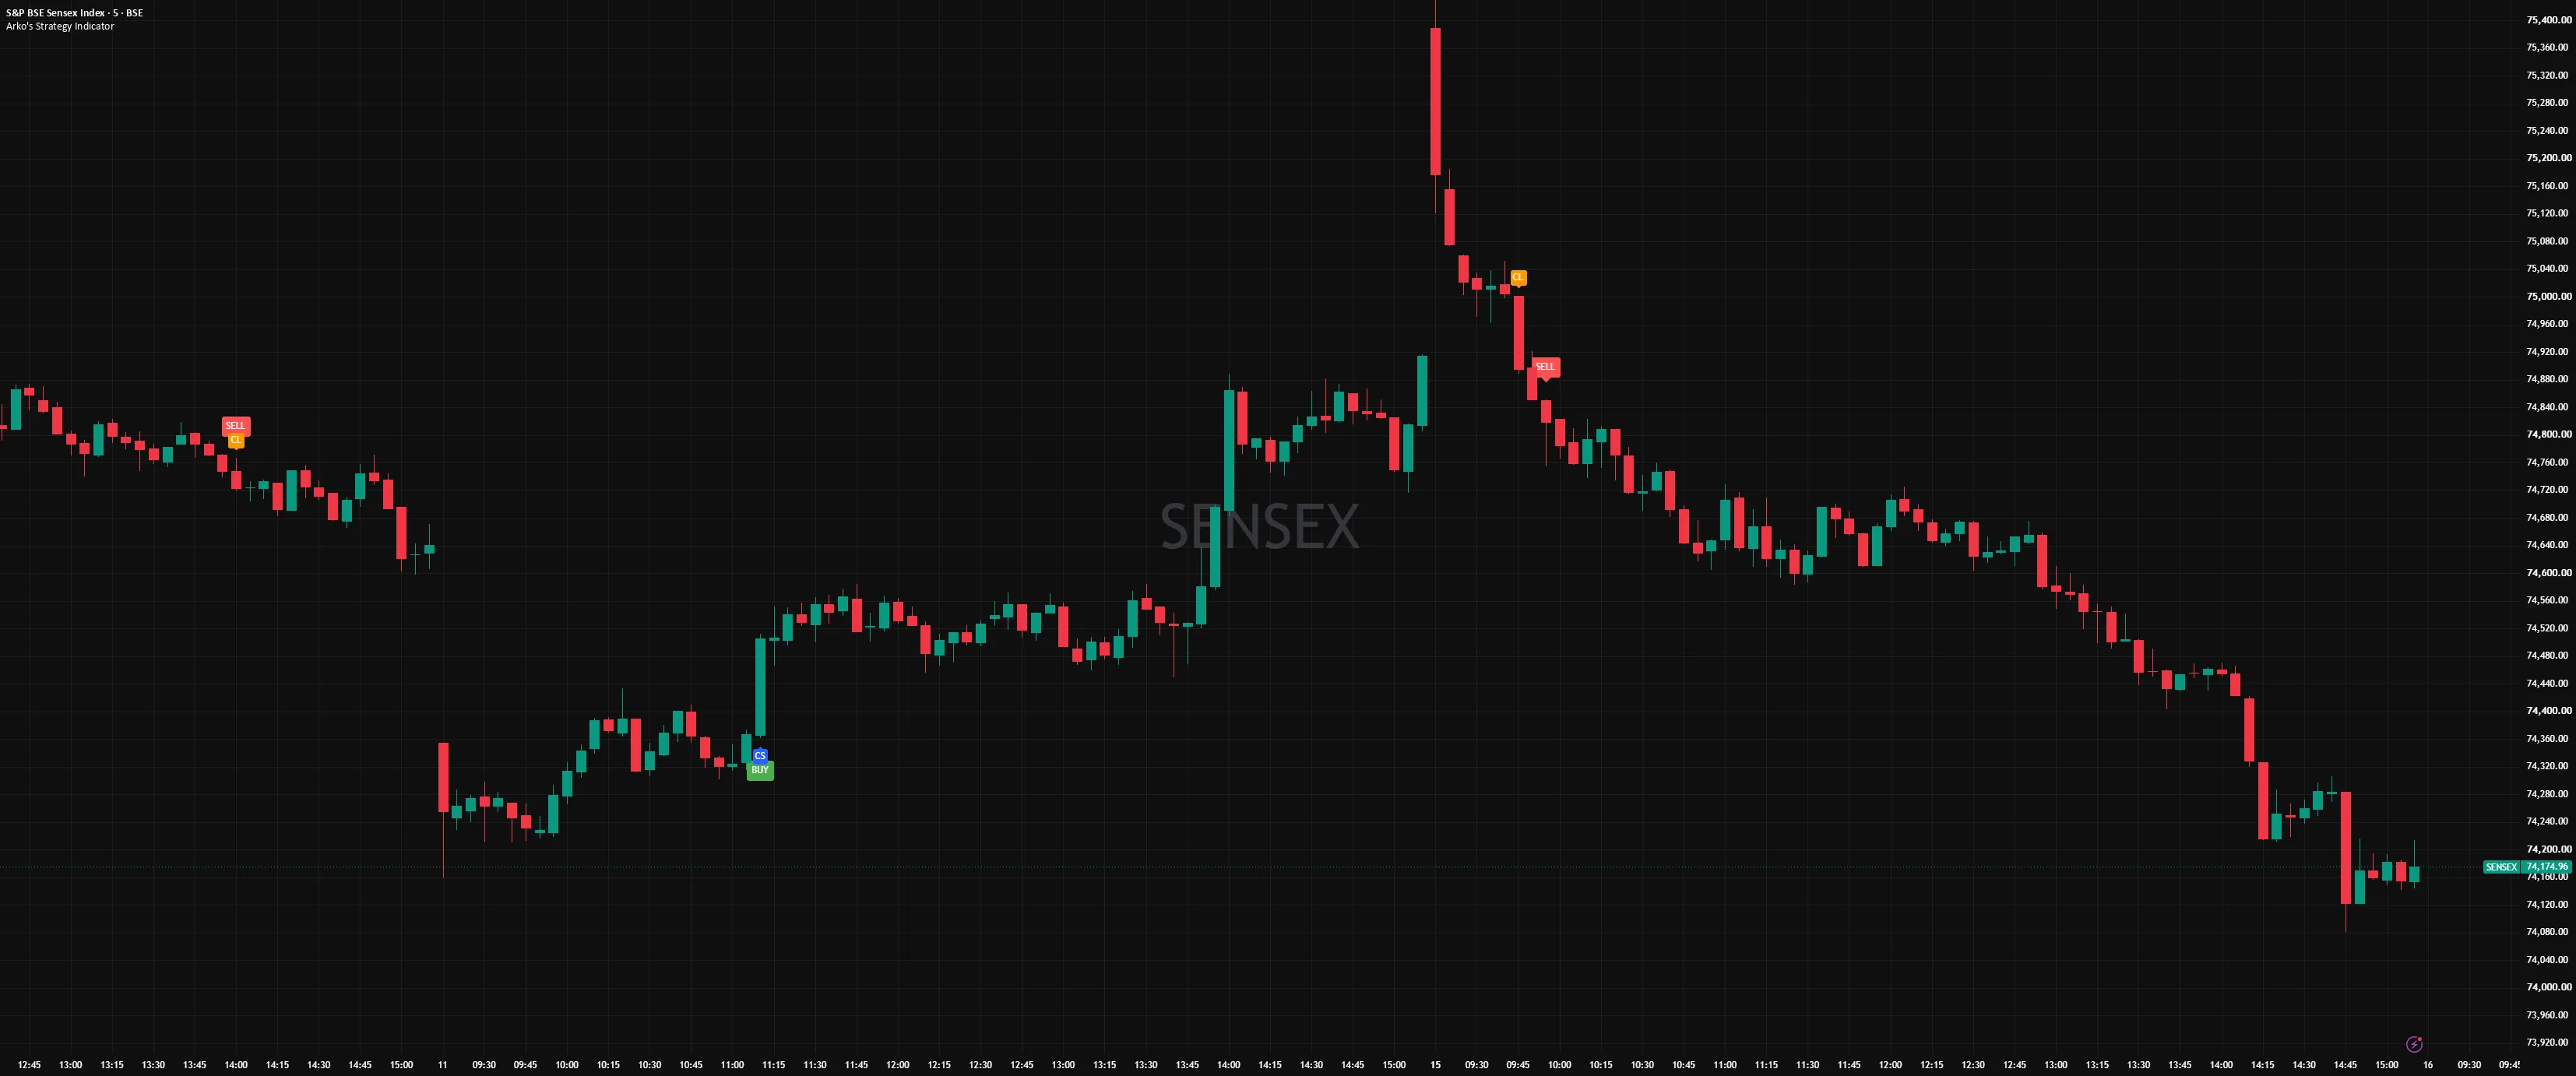
Arko's Strategy Indicator
An invite only TradingView indicator that labels entries and exits on your chart, with two settings that trade off how early it reacts against how much noise it filters out.
Read the guideTradingView · Indicator
HFT Algo Scanner
An invite only TradingView options flow scanner that estimates call and put buying and writing across several strikes and shows it as four coloured columns under the chart, for Indian indices and F&O stocks, with a separate version for US stocks and indices.
Read the guideTradingView · Indicator
HFT Indicator Automation Mode
An invite only TradingView edition of the HFT Indicator made for automation: Buy and Sell labels on the chart, the four options flow columns below, and alerts you can send on to your broker or to Vyuh.
Read the guideTradingView · Indicator
SmartTrend Dynamic Stop Navigator
An invite only TradingView indicator that plots a colour coded trailing stop line and a blue EMA(9) line, and marks Buy and Sell labels that each show a stop level.
Read the guideTradingView · Indicator
Arko's Indicator: Cash Market Sentiment
An invite only TradingView indicator that scores how much volume participation sits behind price moves in indices and stocks, with a scanner table for a list of stocks.
Read the guideTradingView · Indicator
Multi-Asset Scanner
An invite only TradingView indicator that combines SmartTrend Dynamic Stop Navigator and Cash Market Sentiment into one overall bullish, bearish or neutral reading, shown as a background colour and in a table.
Read the guideTradingView · Indicator
Volume Cleaver
An invite only TradingView indicator that splits each forming bar's volume into estimated buy volume above zero and sell volume below zero, with a summary table for the completed bar. Real time only.
Read the guide8 indicators and strategies
All indicators
Guides, markets, plans and how access works.
Research desk · in development
Swing Desk
A research desk for swing and position trades in NSE stocks. Still being built.
Know moreReviews
What traders say
-
“I have used this indicator and it gives me the reversal signs. Use it along with my own setup. … Love the work they are doing.”
 Sayantan Guho Nifty Trader
-
“The HFT Indicator … I don't think there is anything like this in the market. Truly a genius approach. You can also do scalping using this as well.”
 Amitabha Dasgupta Full Time Trader
-
“This is a very powerful weapon and not only it works in the market hours but also try to follow the score for the last 30 mins which will give you an idea of the next day movement.”
 Soumya Banerjee Bank Nifty Trader
-
“Real time tracking of big institutions is the future. Innovation like this is bound to change way people approach trading completely. Chaliye jao boss”
 Rounak Porel @RounakPorel
-
“Brilliant as always. Keep this kind of valuable content coming and make the indian market more and more matured with every passing day as every single retail trader joins the market with confidence after learning such gem of insights.”
Praveen Pramila Mukund Gangarde @ppmgangarde · 17 May 2024 -
“You sir @i_amArko are a genius, I don't know how you catch these big guys buying but they work like a charm …”
Nilesh @ChinmoyBDas · 19 Jun 2024 -
“Absolutely well said, as far as your analysis goes you are spot on. However at the end of the day options trading is the extremely risky. One should always trade as per their risk appetite and have strict SLs in place.”
Adrean Demello @adreandemello1 · 18 Jun 2024 -
“You r best... Analysis was great.... You deserve appreciation....”
Bhawani Singh Bhati @Bhawani92149667 · 20 Jun 2024 -
“Good Money Flow Indicator Mane by Mr. Das”
Piu Ghosh @piughosh07 · 16 May 2024
Reviews are traders' own words and opinions, not advice and not a promise of results. Where a quote is shortened (…), the part left out mentioned returns, accuracy or a specific trade.
We build the tools. You make every call.
Follow along
Questions
Before you start
- Do you give trading tips or calls?
- No. We are not SEBI registered and do not make recommendations. Every decision is yours.
- How do I get access?
- Check out our plans and pricing page.
- Do I need a paid TradingView plan?
- Only for some TradingView features. Alerts, webhook URLs and more chart layouts need a paid plan. For real time prices, connecting your broker account to TradingView may be enough: Dhan, for example, brings real time Indian market data into TradingView. Other brokers are on TradingView's broker list.
- Which markets does it cover?
- Indian indices (Nifty 50, BankNifty, Sensex) and F&O stocks on the NSE and BSE, MCX commodities, and US stocks and indices traded on options, such as SPX, NDX, SPY, QQQ, AAPL, TSLA and NVDA. Each script's guide lists the markets it supports; see where the scripts run.
- Do I get the source code?
- No. The scripts are invite only and the code stays private.
- Does it work on my phone?
- Yes, anywhere TradingView runs.
- Is Vyuh included?
- Yes, with the Indian market and Arko's Strategy & The HFT Algo Scanner plans. On its own it costs Rs 750 a month, and there is a free 3 market day trial while sign-up is open.
Download Vyuh for Windows and try it free for 3 market days. Weekends and market holidays don't count.