Overview
A standard volume bar tells you how much traded during a candle, not how that volume split between buying and selling. Two candles with the same volume can be built very differently inside.
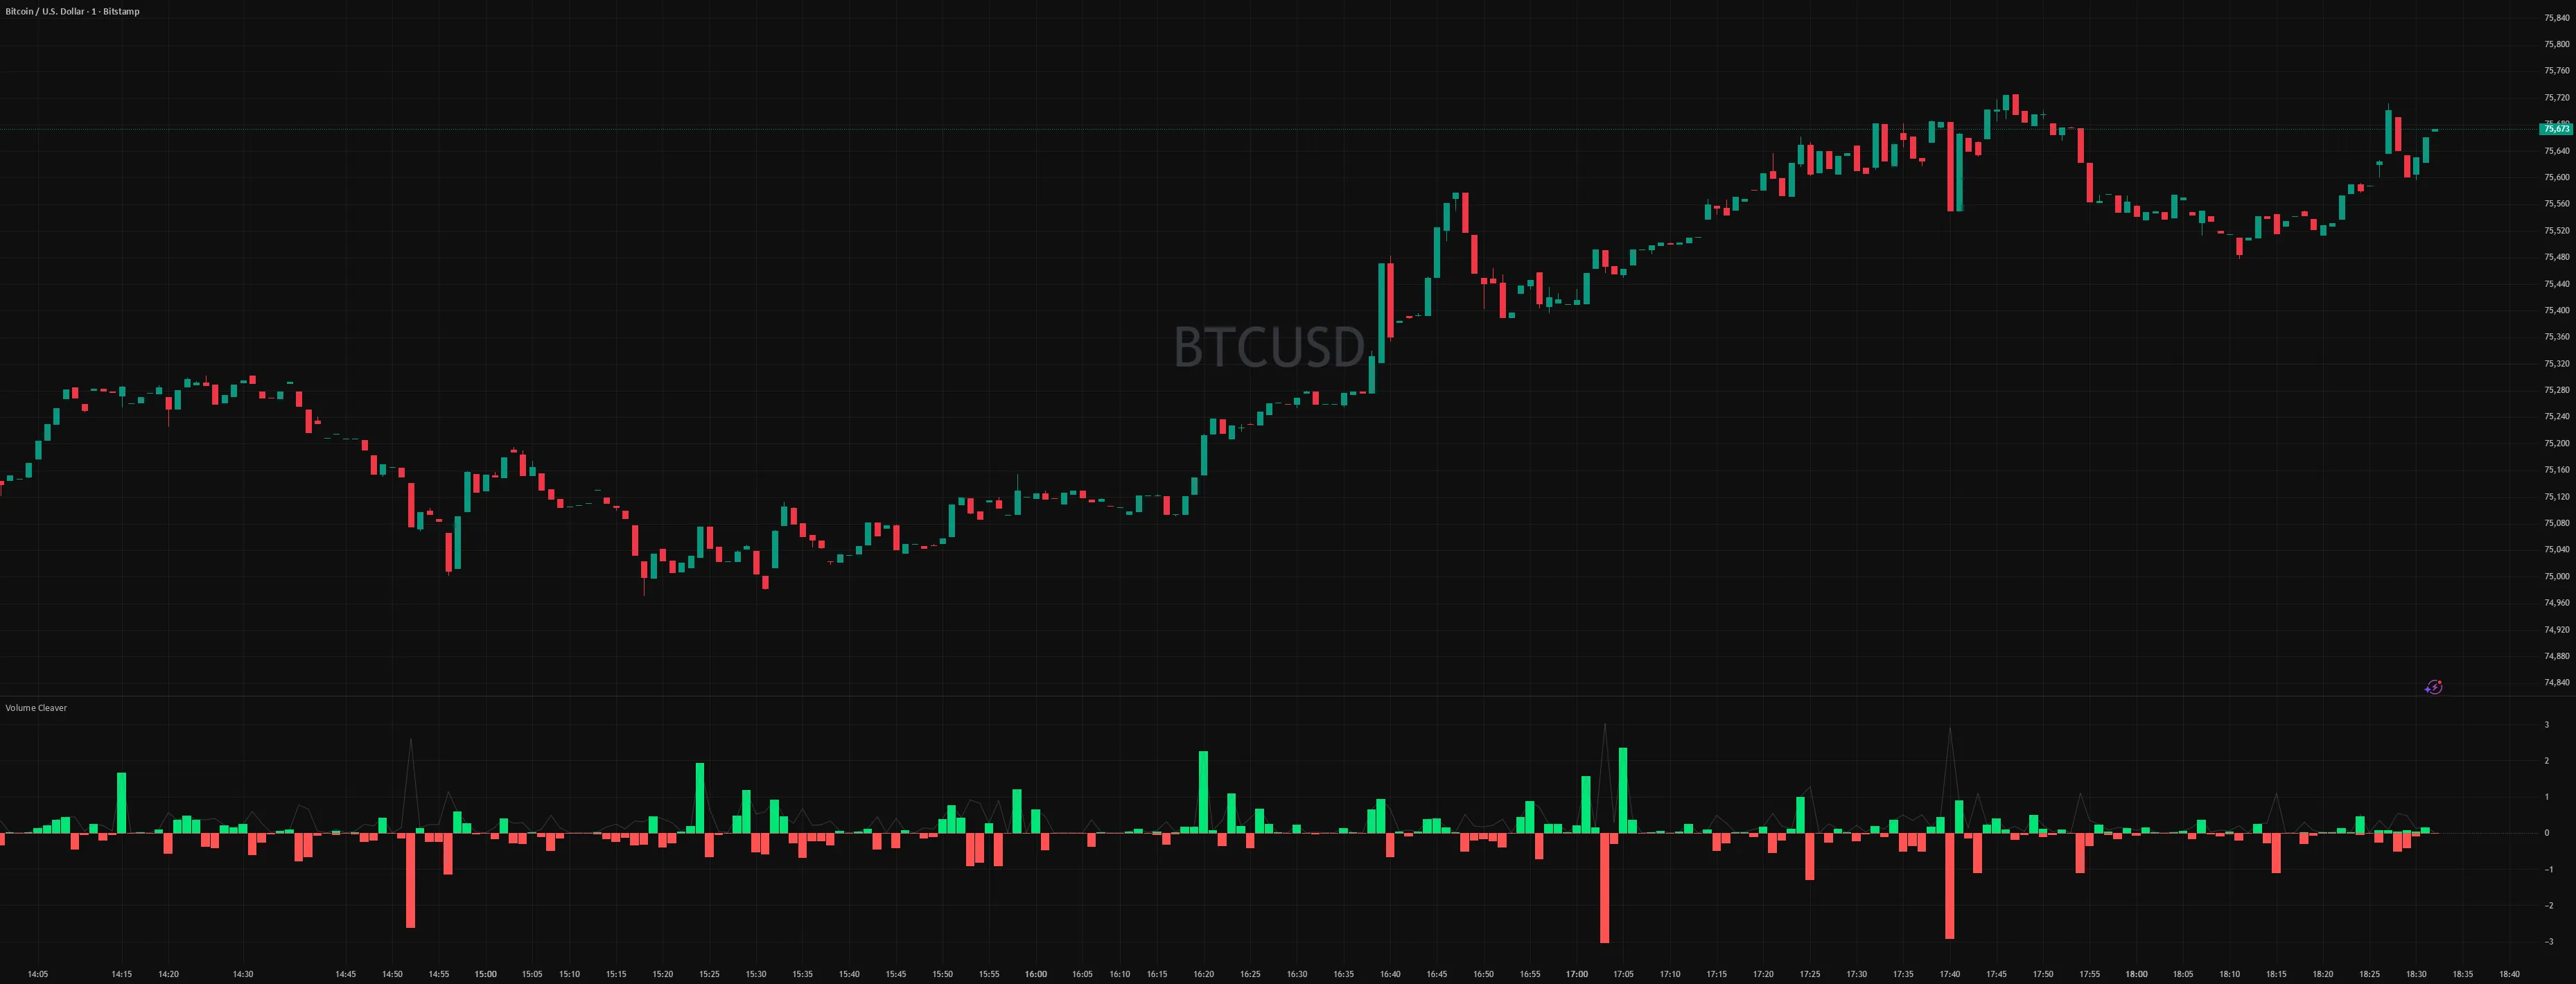
Volume Cleaver splits that one number in two. As each bar forms, it divides the bar’s volume into buy volume, drawn above zero in bright green, and sell volume, drawn below zero in deep red. A small summary table at the top right of the chart shows the buy, sell and total volume for the completed bar.
The description calls these “Aggressive” buy and sell volume (quoted from TradingView); this page explains below why both are estimates. One limitation shapes everything else: it works only in real time, reading the market tick by tick from the moment you add it. What it collects stays on the chart until you reload or change the chart.
Who it suits
- Day traders and scalpers, and futures and stock traders, the groups the description names.
- Traders who want to see the buy and sell split before the candle closes.
- Users of the free TradingView Basic plan, which the description says it works on.
Who it does not suit
- Anyone who wants to study past sessions. Bars from before you added it show plain volume, and a reload or a change of chart clears what it collected.
- Traders who mainly use index charts without volume. On a chart with no volume data there is nothing to split.
- Anyone looking for buy or sell calls. Volume Cleaver plots volume; it produces no entry or exit labels.
- Anyone who needs to see or change the code. The script is invite only and the source stays private.
How it works
According to the description, on the forming bar the indicator uses tick by tick logic to accumulate buy and sell volume as the price moves. In plain terms, it builds up a buy total and a sell total from the live price updates during the bar, drawn as the green and red bars.
The exact rule is not published. The script is invite only and its logic is proprietary, so this page describes only what the public description says.
Why the split is an estimate
It helps to be clear about what any tool of this kind can and cannot see:
- Chart data does not record who started each trade. TradingView scripts see price and volume updates, not whether a buyer lifted the offer or a seller hit the bid. Classifying volume as buy or sell from price movement estimates that.
- Updates can bundle several trades. One real time update can carry volume from trades in both directions, and all of it lands on one side.
- Unchanged prices are a judgement call. When volume arrives without the price moving, any classification depends on a rule.
So read the green and red bars as an estimate of buying and selling pressure within the bar, not as an exact record of buyers and sellers.
Why it only works in real time
The method depends on watching price updates as they happen during the bar. Historical bars on TradingView keep only their open, high, low, close and total volume, not the sequence of updates inside them, which is the usual reason a tool like this cannot rebuild its results. As the description says, “if you reload the chart or the market is closed, you won’t be able to view its results” (quoted from TradingView).
In practice this means:
- It splits volume from the moment you add it. Bars from before that show the same as TradingView’s ordinary volume indicator.
- What it collects stays on the chart for as long as the chart stays as it is.
- Reloading the chart, or changing the symbol or timeframe, clears it. It starts again from that moment.
How to read it on the chart
The volume bars
| What you see | Meaning (per the description) |
|---|---|
| Bright green ↑, above zero | Buy volume on the bar. |
| Deep red ↓, below zero | Sell volume on the bar. |
A taller green bar than red bar means more of the bar’s volume was classified as buying; the reverse means more was classified as selling. These are readings of volume, not recommendations.
The summary table
A panel at the top right of the chart shows the numbers for the completed bar:
| Row | What it shows |
|---|---|
| Buy Volume | Volume classified as buying. |
| Sell Volume | Volume classified as selling. |
| Total Volume | All volume on the bar. |
Buy volume and sell volume always add up to the total volume: every unit of volume on the bar is counted as either buying or selling.
Settings
There is nothing to set. Add it to the chart and it starts working.
The one rule is to leave the chart alone while it works: don’t reload it and don’t switch the symbol or timeframe, because that clears everything it has collected so far.
Timeframes
Any timeframe, per the description. On higher timeframes, a bar covers a long stretch of time, so a reload partway through clears more of what was collected.
Markets
It works on any chart with volume data (“any chart that has volume data”, in the description’s words). On Indian markets, note that many index charts on TradingView, such as Nifty 50 or BankNifty, carry no traded volume of their own. Index futures and stocks do. Volume data quality also varies by data feed and instrument.
Getting started
- Get access. Choose a plan on the pricing page and pay online. The order form asks for your TradingView username; we never ask for your TradingView password.
- Access arrives by itself. Once the payment goes through, the script is added to your TradingView username automatically, usually within a few minutes, and we email you when it’s done.
- Open a chart with volume during market hours. For example, a stock or an index futures contract rather than the index itself.
- Add it to the chart. In TradingView, click Indicators, open Invite-only scripts, and choose Volume Cleaver.
- There is nothing to set. It starts splitting volume straight away.
- Leave the chart as it is. The split builds up only while the chart stays open. Reloading it, or switching the symbol or timeframe, clears what has been collected.
Strengths and limitations
Strengths
- More detail than a single volume bar. You see an estimated split between buying and selling as the bar forms, not just its total.
- Nothing to set up. Add it to a chart and it works.
- A simple display. Green above zero, red below zero, and one small table.
- Any timeframe, and the free plan. Per the description, it works on any timeframe and on the free TradingView Basic plan.
Limitations
- Real time only. It splits volume only from the moment you add it; earlier bars show plain volume. Reloading the chart or changing the symbol or timeframe clears what it collected. You cannot review past sessions or test it on history.
- It is an estimate. Classifying volume as buy or sell from price movement is an approximation, not a record of who traded.
- Needs real volume. Index charts without traded volume, and instruments with thin or patchy volume data, give nothing useful to split.
- Depends on your connection and data feed. Because it builds its picture from live updates, a lagging connection or a delayed data feed affects what it collects.
- No signals. It shows volume only. Any decision about what the split means is yours.
- Closed code. It is invite only with private source, so you cannot audit the classification rule.
- No published performance. No figures are given on TradingView or on this site.
Release notes
All times in IST.
| Date | Note (from TradingView) |
|---|---|
| 19 Apr 2026, 18:32 | First published. |
No updates have been published since.
Frequently asked questions
What does Volume Cleaver show? It splits each forming bar’s volume into buy volume above zero (bright green) and sell volume below zero (deep red), and shows buy, sell and total volume for the completed bar in a table at the top right.
Why are the results gone after I reload the chart? The indicator works only in real time. It builds the split from live, tick by tick price updates, which historical bars do not keep. Reloading the chart, or changing the symbol or timeframe, clears what it collected, and the bars before that show plain volume, the same as TradingView’s ordinary volume indicator. Leave the chart as it is to keep the split.
Do I need to change any settings? No. Add it to the chart and it starts working.
Is the buy and sell split exact? No. Classifying volume as buy or sell from price movement is an estimate, because chart data does not record who started each trade.
Does it work on Nifty or BankNifty? It needs a chart with volume data. Index charts often have no volume of their own, so use a chart that does, such as the futures contract. It works on any chart with volume data.
Does it work on the free TradingView plan? Yes, according to the description: it “will also work on the basic free TradingView account” (quoted from TradingView).
Does it tell me what to trade? No. We are not SEBI registered and do not give recommendations, tips or calls. Volume Cleaver shows volume, and every decision is yours.