Summary
Updated 10 November 2026. The setups re-run for this report now run to 9 November 2026. They come from the backtest results, which re-run them after each trading day, so they differ from the 7 November edition: one more trading day, costs charged on every order at its fill price, and, for the monthly setups, the monthly contract priced correctly from 12 October 2026 (the edition used the weekly one by mistake). The grid research tables and charts are marked as such and keep their data to 28 October 2026.
For an option buyer, which option is bought and how the trade is closed mattered more than anything else. The study ran 34,534 backtests of option buying on Arko’s Strategy signals: a call is bought on a Buy signal and a put on a Sell signal. It tested five chart timeframes, both closing modes, nine strengths, fourteen ways of choosing the strike, weekly and monthly expiries, and more than 200 exit rules per setup.
- The best setup earned Rs 6,11,144 before costs on one lot (Rs 5,28,599 after costs), about 1.9x the plain baseline after costs (Rs 2,76,234), and was profitable in every year. It is the 5 minute chart, Shorter Closing, Strength 5, buying the cheapest strike priced at Rs 250 or more, with a +200 point target and a 25% stop loss. Accuracy was 35.0% and maximum drawdown Rs −71,915.
- Choosing the strike by premium beat choosing by moneyness. Buying the cheapest strike whose premium is at least Rs 200 to 250 earned more than ATM, ITM or cheap out of the money options. Plain ATM buying earned only Rs 1,66,545.
- A fixed points target with a 25% stop beat every trailing stop and every profit lock, on every timeframe. A +200 to +250 point target captured the large spikes that pay for the small losses; the 25% stop limited the losers.
- 5 minute, Shorter Closing, Strength 5 was the best signal setting for buying. 15 minute Strength 1 and 3 minute Lengthy Strength 7 were the strongest alternatives; 30 minute Lengthy was negative or close to zero at every strength.
- Carrying positions overnight mattered. Closing every trade by 15:15 lost money on every timeframe.
- High accuracy was available, at a cost. Profit locks and tight trails pushed accuracy to 63% to 73% while staying profitable each year, but earned Rs 1.6 to 3.0 lakh instead of Rs 5.3 lakh. Reentering after a profit lock rarely helped a buyer.
Setups by trader profile
1 lot, five years, before and after costs, realistic fills.
| Setup | Before costs | After costs | Accuracy | Max DD | Character |
|---|---|---|---|---|---|
| 5m Shorter s5, premium ≥ 250, target +200 pts, SL 25% | 6,11,144 | 5,28,599 | 35.0% | −71,915 | Highest profit, every year positive |
| 15m Shorter s1, premium ≥ 200, target +250 pts, SL 25% | 5,29,548 | 4,97,160 | 32.0% | −99,209 | Fewer trades (about 1,400); slower chart |
| Monthly, 5m s5, premium ≥ 100, target +150%, SL 25% | 4,53,866 | 4,16,977 | 33.2% | −43,976 | Lowest drawdown |
| 5m s5, premium ≥ 200, lock +10 pts keep 40%, 15 minute reentry | 4,10,754 | 2,90,062 | 62.8% | −71,954 | Wins more often |
Source: Arko's Strategy Research. Hypothetical backtest, Nifty 50 index options, 11 Oct 2021 to 9 Nov 2026, 1 lot, statutory costs, zero brokerage, 1 tick slippage per order. All amounts in Rs. Accuracy = trades profitable before costs.
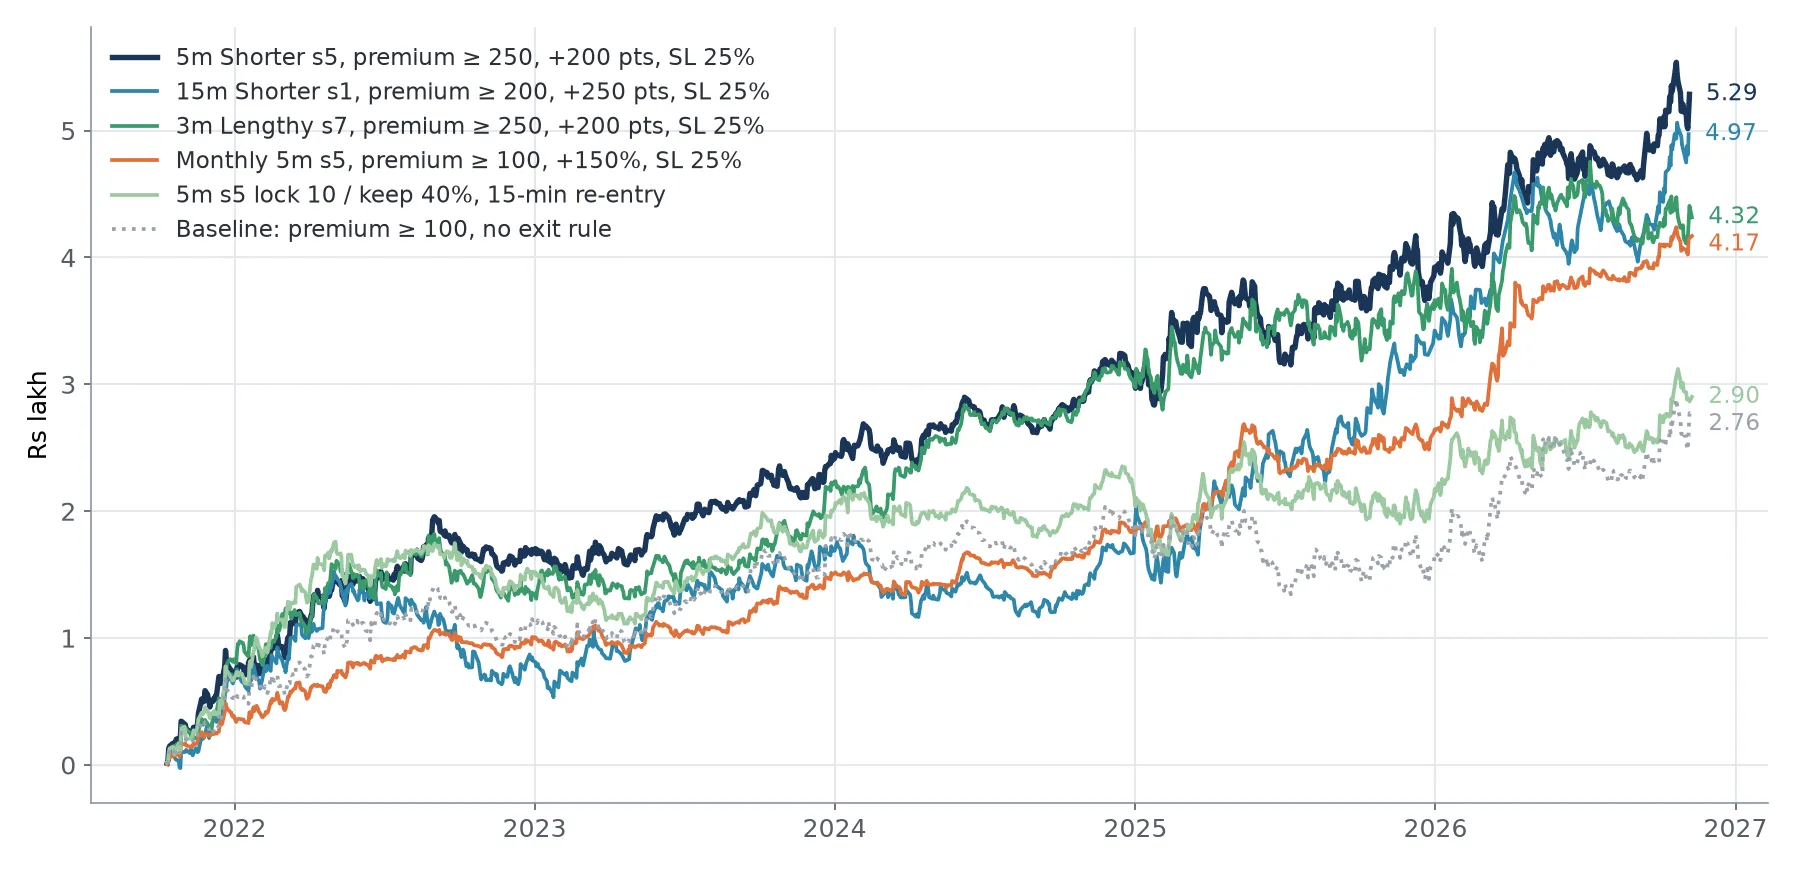
Cumulative profit after costs, leading setups against the baseline (Rs lakh, 1 lot). Hypothetical backtest; past performance does not guarantee future results.
Introduction
Option buying has a simple shape: most trades lose a little and a few win a lot. Over five years and more than 34,000 backtests, the decisive question for a buyer was not when to enter, because the entries come from Arko’s Strategy, but which option to buy and how to get out.
Arko’s Strategy is a proprietary signal model on the Nifty 50 index chart. It produces a Buy signal (bullish), a Sell signal (bearish) and a close signal. The signal logic is not published; this report covers how the signals behaved when traded by buying options. The companion option selling report studies the same signals from the seller’s side.
How the trade works
- A Buy signal buys a call (CE); a Sell signal buys a put (PE). A buyer profits when the option’s premium rises.
- A close signal sells the option. Only one position is open at a time; an opposite signal closes the existing position and opens the new one on the same candle.
- Strike: unless stated otherwise, the strike is the cheapest option whose premium is at least the stated amount (for example “premium ≥ 250”), chosen at entry.
- Weekly expiry: every trade uses the nearest Nifty expiry. In the week when the monthly contract is the nearest expiry, it is treated as that week’s weekly expiry. “Monthly” setups use the current monthly contract throughout.
- Positions are carried overnight until the strategy closes them, an exit rule fires, or expiry arrives; the position is then rolled to the next expiry.
- Exit rules are added on top of the strategy’s own close signal; whichever comes first ends the trade.
Exit rules tested
| Rule | What it does | Settings tested |
|---|---|---|
| No exit rule | Hold until the strategy’s close signal or expiry | n/a |
| Stop loss | Sell if the premium falls by a set % | 15% to 60% |
| Target (%) | Sell when the premium rises by a set % | +25% to +300% |
| Target (points) + stop | Sell at entry + N points, or at the stop | +100 to +300 pts; stop none or 20% to 40% |
| Trailing stop (%) | After a % gain, sell if the premium falls a set % from its high | Start 10% to 100%, trail 10% to 50%, optional stop |
| Trailing stop (points) | After N points of profit, sell if the premium falls M points from its high | Start 10 to 75 pts, trail 10 to 50 pts |
| Profit lock | After N points of profit, sell if the premium gives back more than a set share of the best profit | Start 10 to 50 pts, keep 40% to 70% |
| Profit lock + reentry | As above, then buy the same option again if the move resumes | After 15 minutes; +5 or +10 pts above the exit; Nifty +20 pts |
| Same day exit | Sell everything at 15:15 or 15:25; no overnight positions | With and without a stop |
Source: Arko's Strategy Research. Hypothetical backtest, Nifty 50 index options, 11 Oct 2021 to 9 Nov 2026, 1 lot, statutory costs, zero brokerage, 1 tick slippage per order. All amounts in Rs. Accuracy = trades profitable before costs.
Data and method
Data and costs
Option prices are one minute prices for every Nifty 50 index option contract from 11 October 2021 to 9 November 2026, including the monthly contract in the weeks it serves as the weekly expiry. Every backtest trades one lot at the lot size in force on the trade date. All results are after costs: securities transaction tax at the rates in force on each date, exchange and SEBI fees, stamp duty and GST, with zero brokerage, as offered by several Indian brokers, plus one tick (Rs 0.05) of slippage on every order.
Realistic fills
Rules that react to a price level, such as targets and stop losses, were checked again against each minute’s high and low, not only its closing price. A stop is filled at the stop price, or worse when the price gaps through it, minus two further ticks; a target is filled at the target price; when both are touched in the same minute, the stop is assumed to fill first. All headline numbers for target and stop setups use these fills. Trailing stops and profit locks are evaluated on one minute closing prices, as an alert driven trader would execute them.
Robustness
A setup is only listed among the leading setups when it is profitable in every calendar year and in both halves of the period (split on 15 April 2024), when neighbouring settings also work, and when it survives a second tick of slippage on every order.
Metrics
- Accuracy: the share of trades with a positive result before costs. The share after costs is 0.0 to 1.1 percentage points lower. Tables from the grid search, on data to 28 October 2026, show accuracy after costs, as noted under each.
- Max drawdown (DD): the largest fall in cumulative profit from a previous high, in rupees.
- Profit: total profit after costs over the full period, one lot.
Results
Signal settings: timeframe, closing mode and strength
The strategy was first run with no exit rule, buying the cheapest option at Rs 100 or more, on every combination of chart timeframe (3, 5, 10, 15 and 30 minutes), closing mode (Shorter and Lengthy) and strength (1 to 8 and 10). The 5 minute chart, Shorter Closing, Strength 5 was the best combination, with Strength 6 next to it; this is the setting used for the rest of the study unless stated otherwise.
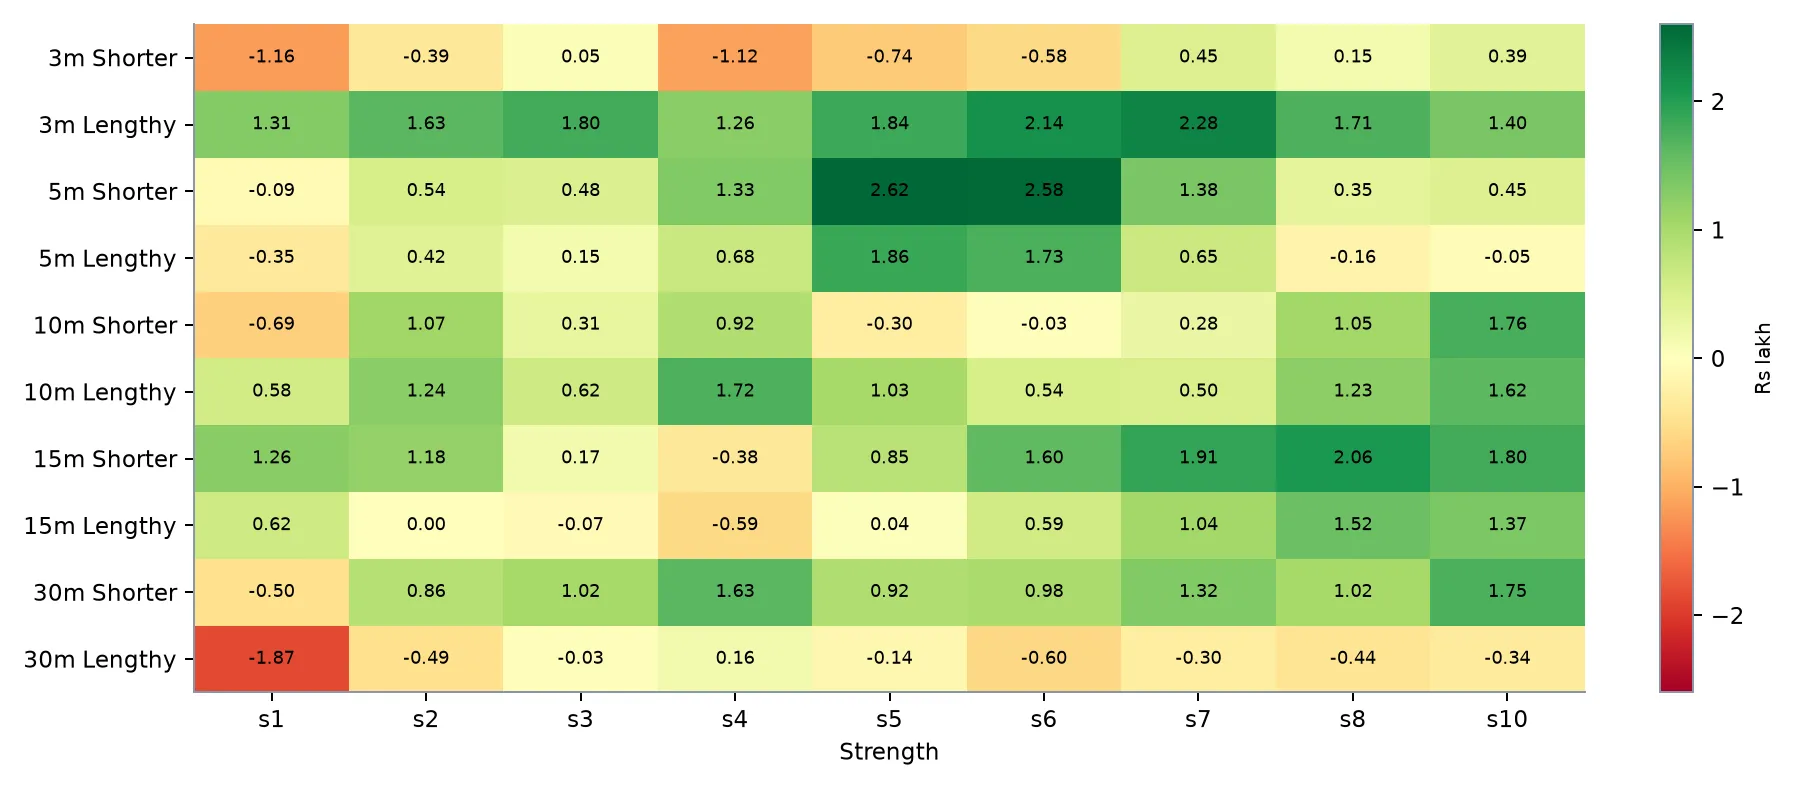
Profit after costs by signal setting (Rs lakh; no exit rule, premium ≥ Rs 100, weekly). Grid research on data from 11 Oct 2021 to 28 Oct 2026. Hypothetical backtest, 1 lot.
- 3 minute charts worked only with Lengthy Closing; with Shorter Closing they traded 4,000 to 7,000 times and costs ate the gains.
- 10 and 15 minute charts worked best at high strengths (8 to 10), or at Strength 1 on 15 minute Shorter.
- 30 minute Lengthy Closing was negative or close to zero at every strength, down to Rs −1.87 lakh at Strength 1.
Which option to buy
With the signal setting fixed, the choice of option mattered a great deal. Premium based selection adapts to volatility: in calm markets it picks a strike near the money, in volatile markets one further out. Profit rose with the premium up to about Rs 200 and fell after Rs 250, as expensive options cost more per lot than they gain in speed.
Strike choice with no exit rule, 5m Shorter s5.
| Strike rule | Profit | Accuracy | Max DD | First half | Second half |
|---|---|---|---|---|---|
| Premium ≥ Rs 50 | 1,70,876 | 28.1% | −53,302 | 1,04,823 | 66,054 |
| Premium ≥ Rs 75 | 2,14,310 | 29.5% | −64,795 | 1,34,146 | 80,164 |
| Premium ≥ Rs 100 (baseline) | 2,61,892 | 30.9% | −68,852 | 1,58,540 | 1,03,352 |
| Premium ≥ Rs 125 | 2,99,048 | 31.8% | −72,768 | 1,73,331 | 1,25,717 |
| Premium ≥ Rs 150 | 3,35,632 | 32.8% | −76,257 | 1,88,545 | 1,47,088 |
| Premium ≥ Rs 175 | 3,50,703 | 33.5% | −80,412 | 2,01,412 | 1,49,291 |
| Premium ≥ Rs 200 | 3,55,347 | 34.0% | −83,360 | 1,98,490 | 1,56,857 |
| Premium ≥ Rs 225 | 3,35,402 | 34.2% | −84,997 | 1,93,692 | 1,41,710 |
| Premium ≥ Rs 250 | 2,87,234 | 34.5% | −87,489 | 1,71,057 | 1,16,178 |
| Premium ≥ Rs 300 | 1,21,736 | 35.1% | −90,158 | 83,851 | 37,885 |
| ATM | 1,42,384 | 29.0% | −90,130 | 1,06,610 | 35,774 |
| ITM1 | 2,40,822 | 31.6% | −78,102 | 1,55,953 | 84,869 |
| ITM2 | 2,70,974 | 32.8% | −82,542 | 1,84,032 | 86,942 |
| ITM3 | 2,93,279 | 33.7% | −84,980 | 1,99,667 | 93,611 |
| Monthly, premium ≥ Rs 100 | 3,81,329 | 33.2% | −51,711 | 1,32,790 | 2,48,540 |
Source: Arko's Strategy Research, grid research on data from 11 Oct 2021 to 28 Oct 2026. Hypothetical backtest, Nifty 50 index options, 1 lot, statutory costs, zero brokerage, 1 tick slippage per order. All amounts in Rs. Accuracy in this table = trades profitable after costs.
The monthly series earned more than weekly at the same premium (Rs 3,81,329) with a smaller drawdown, because monthly options lose value more slowly; most of its profit, however, came from the second half of the period.
Exit management: the lever that matters
Every exit rule was applied to the same trades (5m Shorter s5, premium ≥ Rs 200, weekly). The table shows the best setting in each family and how many settings in the family beat holding with no rule. One minute closing prices.
| Exit family | Best setting | Profit | Accuracy | Max DD | Beat no rule |
|---|---|---|---|---|---|
| No exit rule | none | 3,55,578 | 34.1% | −83,332 | n/a |
| Stop loss only | SL 20% | 4,11,314 | 33.5% | −81,958 | 4 / 7 |
| Target (%) only | +110% | 4,65,184 | 34.1% | −83,332 | 9 / 11 |
| Target (%) + stop | +110% / SL 20% | 5,14,269 | 33.5% | −81,958 | 48 / 50 |
| Target (points) + stop | +225 pts / SL 20% | 5,06,831 | 33.6% | −75,716 | 32 / 32 |
| Trailing stop (%) | start 50%, trail 20%, SL 30% | 4,05,302 | 34.3% | −81,864 | 38 / 48 |
| Trailing stop (points) | start 50 pts, trail 30 pts | 4,39,934 | 38.3% | −77,906 | 12 / 25 |
| App profit lock (% start) | start 20%, keep 50% | 3,78,337 | 39.5% | −98,737 | 4 / 15 |
| Profit lock, no reentry | start 50 pts, keep 60% | 4,45,434 | 38.5% | −77,660 | 3 / 12 |
| Profit lock + reentry | start 50 pts, keep 50%, 15 minute reentry | 4,24,332 | 38.2% | −72,316 | 11 / 48 |
| Same day exit | exit 15:15, SL 30% | 2,84,755 | 37.3% | −69,313 | 0 / 4 |
Source: Arko's Strategy Research, grid research on data from 11 Oct 2021 to 28 Oct 2026. Hypothetical backtest, Nifty 50 index options, 1 lot, statutory costs, zero brokerage, 1 tick slippage per order. All amounts in Rs. Accuracy in this table = trades profitable after costs.
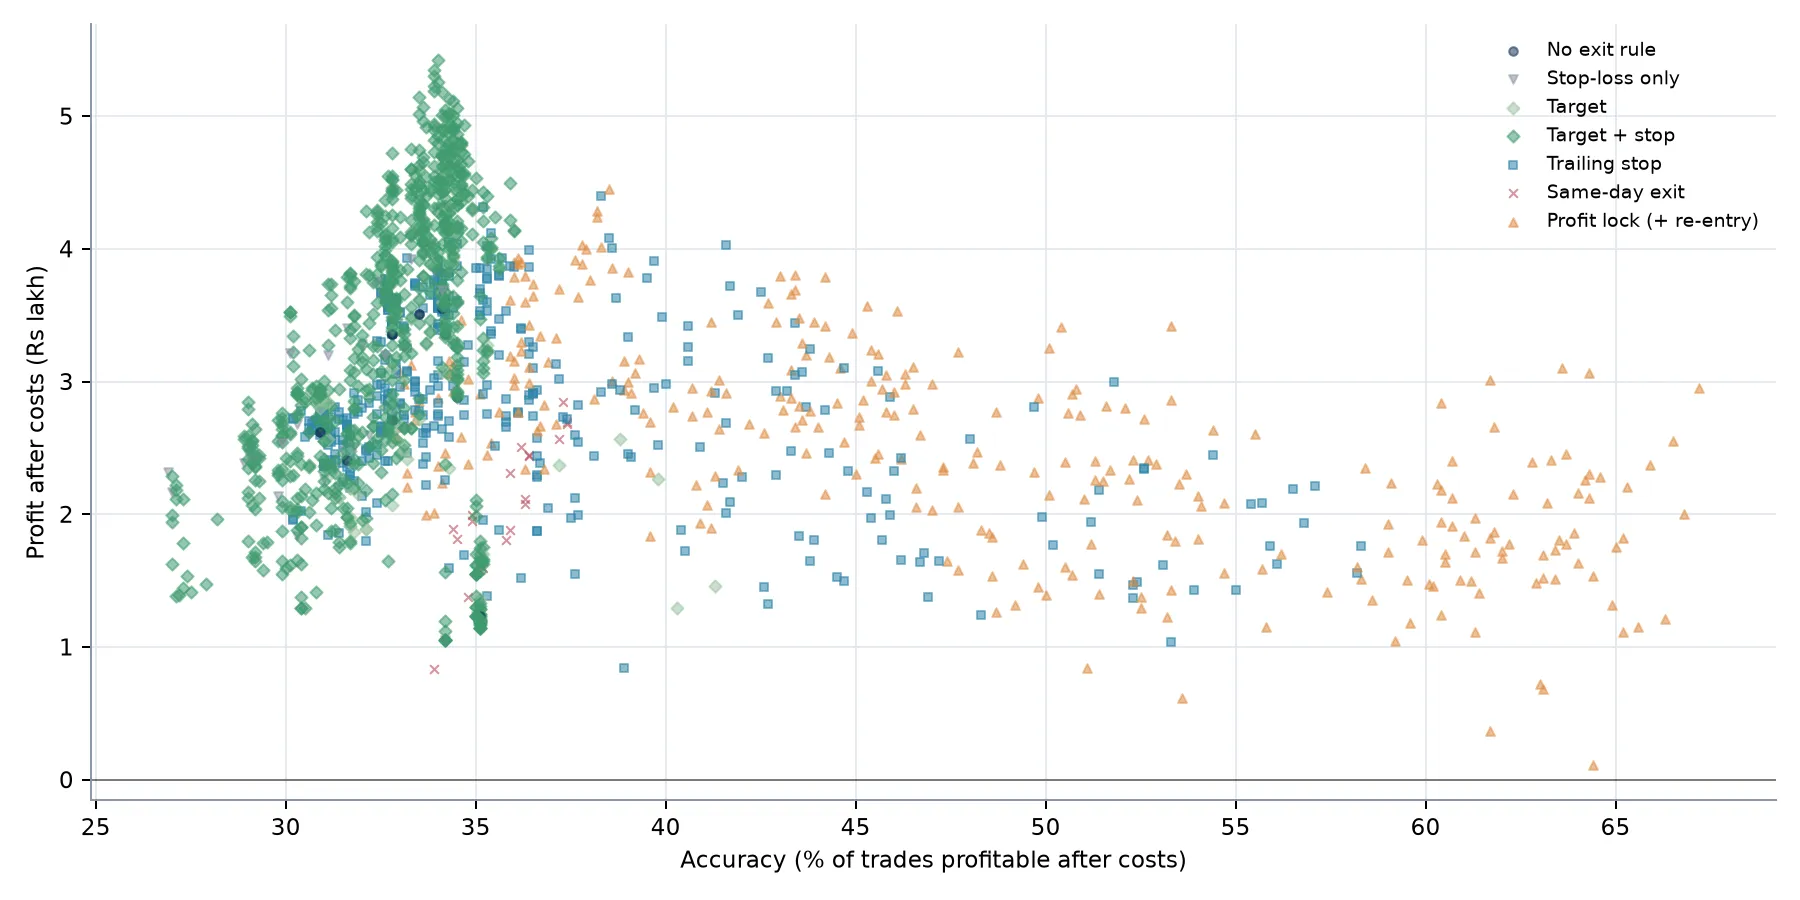
Accuracy against profit for every exit rule on weekly 5m signals (each point is one backtest). Grid research on data from 11 Oct 2021 to 28 Oct 2026, accuracy after costs. Hypothetical backtest, 1 lot, one minute closing prices; target and stop points are slightly optimistic before the high/low check below.
Realistic fills and slippage
Targets and stops were tested again against each minute’s high and low. A 20% stop looked best on closing prices but was hit too often by brief dips once the lows were counted; 25% to 30% stops were the most reliable. The leading setups lost little or even gained, because targets were also reached sooner on intraday highs.
Closing price fills against high/low fills, 5m Shorter s5, weekly unless stated.
| Setup | Closing price fills | High/low fills | Accuracy | Max DD |
|---|---|---|---|---|
| Premium ≥ 250, target +200 pts / SL 25% | 4,95,179 | 5,18,373 | 34.5% | −71,853 |
| Premium ≥ 250, target +200 pts / SL 20% | 5,11,025 | 4,93,042 | 33.9% | −70,392 |
| Premium ≥ 250, target +200 pts / SL 30% | 4,73,141 | 4,85,692 | 34.5% | −74,892 |
| Premium ≥ 200, target +225 pts / SL 25% | 4,85,168 | 4,77,615 | 33.7% | −73,109 |
| Premium ≥ 225, target +250 pts / SL 20% | 5,34,748 | 4,92,934 | 33.4% | −73,661 |
| Premium ≥ 225, target +175 pts / SL 25% | 5,00,291 | 4,56,270 | 34.1% | −72,788 |
| Monthly, premium ≥ 100, target +150% / SL 25% | 4,40,975 | 4,27,682 | 32.9% | −43,972 |
| Premium ≥ 300, target +100 pts / SL 20% | 4,49,296 | 3,32,712 | 35.8% | −61,230 |
Source: Arko's Strategy Research, grid research on data from 11 Oct 2021 to 28 Oct 2026. Hypothetical backtest, Nifty 50 index options, 1 lot, statutory costs, zero brokerage, 1 tick slippage per order. All amounts in Rs. Accuracy in this table = trades profitable after costs.
Slippage stress: one extra tick on every order, closing price basis.
| Setup | Trades | 1 tick | 2 ticks | Change |
|---|---|---|---|---|
| Premium ≥ 250, +200 pts, SL 25% | 2,854 | 4,95,179 | 4,79,680 | −3% |
| Premium ≥ 200, +225 pts, SL 25% | 2,856 | 4,85,168 | 4,69,656 | −3% |
| Monthly premium ≥ 100, +150%, SL 25% | 2,788 | 4,40,975 | 4,25,822 | −3% |
| Premium ≥ 200, points trail 10 / 50 | 2,846 | 4,31,855 | 4,16,411 | −4% |
| Premium ≥ 200, lock 10 / keep 40%, reentry | 4,858 | 3,01,434 | 2,75,054 | −9% |
| Premium ≥ 200, lock 10 / keep 60%, reentry | 5,610 | 2,55,058 | 2,24,680 | −12% |
| Baseline (premium ≥ 100, no rule) | 2,862 | 2,61,892 | 2,46,358 | −6% |
Source: Arko's Strategy Research, grid research on data from 11 Oct 2021 to 28 Oct 2026. Hypothetical backtest, Nifty 50 index options, 1 lot, statutory costs, zero brokerage, 1 tick slippage per order. All amounts in Rs. Accuracy in this table = trades profitable after costs. Profit locks with reentry trade about twice as often, so slippage costs them two to three times as much.
Other timeframes
The full search was repeated on 3, 10, 15 and 30 minute charts: 176 signal and strike combinations (Shorter and Lengthy Closing; strengths 3, 5, 7, 8, 10, plus Strength 1 on 15 and 30 minutes; weekly ATM, premium ≥ Rs 200, premium ≥ Rs 250 and monthly ATM), each with more than 200 exit rules, 31,504 backtests in all. The best setup on each timeframe again used a points target with a 25% stop.
Best setup per timeframe, high/low fills. Year columns in Rs thousand (k).
| Chart | Setup | Profit | Accuracy | Max DD | 2021* | 2022 | 2023 | 2024 | 2025 | 2026* |
|---|---|---|---|---|---|---|---|---|---|---|
| 5m Shorter s5 | Premium ≥ 250, +200 pts, SL 25% | 5,28,599 | 35.0% | −71,915 | 72.6k | 96.0k | 71.3k | 66.6k | 85.9k | 136.2k |
| 15m Shorter s1 | Premium ≥ 200, +250 pts, SL 25% | 4,97,160 | 32.0% | −99,209 | 64.2k | 17.8k | 86.5k | 17.3k | 156.6k | 154.7k |
| 3m Lengthy s7 | Premium ≥ 250, +200 pts, SL 25% | 4,31,651 | 35.1% | −64,976 | 83.3k | 50.5k | 86.7k | 79.2k | 66.7k | 65.2k |
| 10m Lengthy s5 | Monthly ATM, +200 pts, SL 25% | 3,65,530 | 29.2% | −86,615 | 33.8k | 4.6k | 31.9k | 36.1k | 84.0k | 175.0k |
| 30m Shorter s10 | Monthly ATM, +250 pts, SL 25% | 2,75,351 | 29.2% | −53,879 | 11.2k | 78.8k | 2.8k | 17.9k | 127.3k | 37.3k |
* 2021 from 11 October; 2026 to 9 November. Source: Arko's Strategy Research. Hypothetical backtest, Nifty 50 index options, 11 Oct 2021 to 9 Nov 2026, 1 lot, statutory costs, zero brokerage, 1 tick slippage per order. All amounts in Rs. Accuracy = trades profitable before costs.
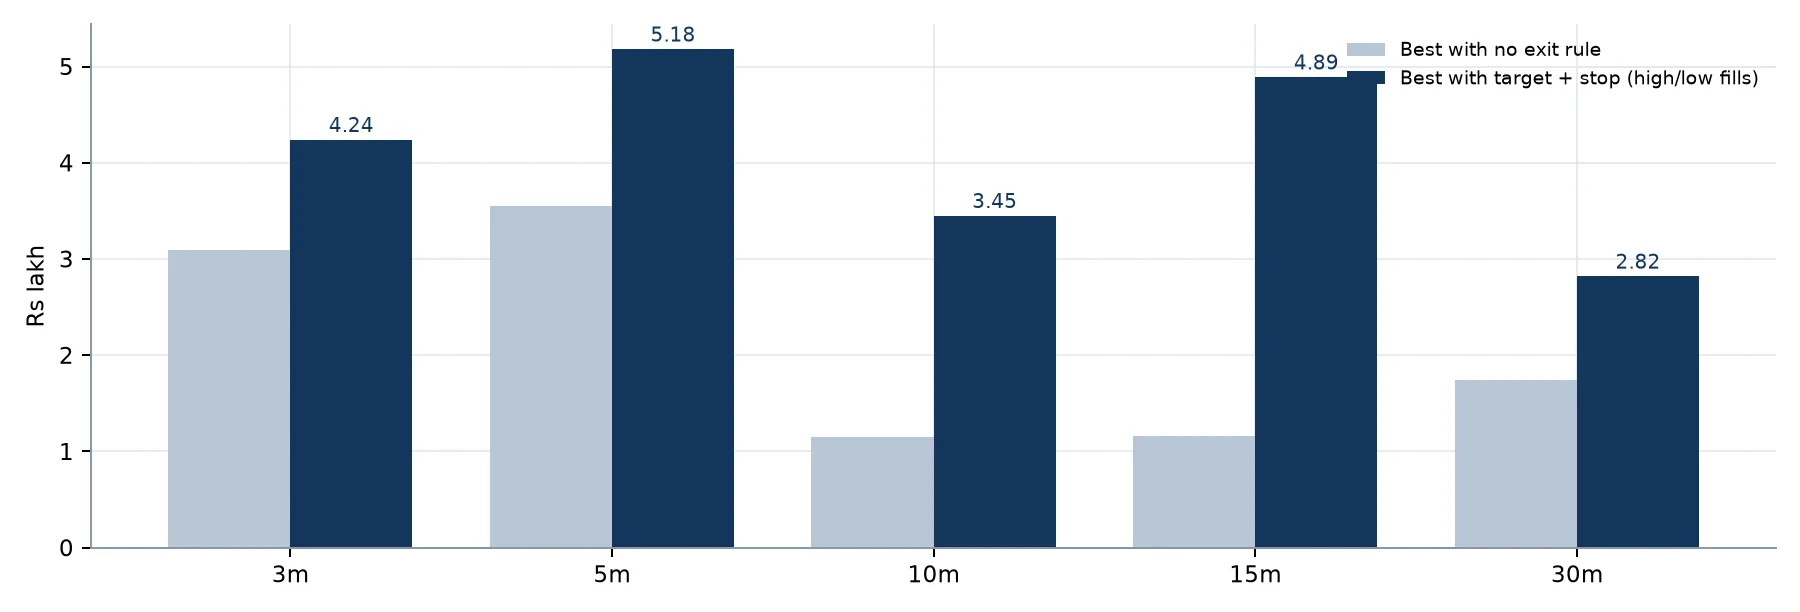
Best profit per timeframe: no exit rule against target and stop (Rs lakh, 1 lot). Grid research on data from 11 Oct 2021 to 28 Oct 2026. Hypothetical backtest.
- 15 minute Shorter Strength 1 was the strongest alternative (Rs 4,97,160, profitable every year), but 2022 and 2024 were thin (Rs 17.8k and Rs 17.3k) and its drawdown was larger.
- 3 minute Lengthy Strength 7 was the steadiest alternative (Rs 4,31,651, every year Rs 50k or more); in the grid search, neighbouring strengths 5, 8 and 10 also earned Rs 3.3 to 3.7 lakh on closing prices.
- 10 and 30 minute setups were profitable but depended on one or two strong years.
- Strength 1 on 30 minute Lengthy stayed weak even with the best exit (Rs 0.63 lakh in the grid search).
ATM buying: the retail favourite
Most retail buyers buy the at the money option. On Arko’s Strategy signals it was the weakest strike: weekly ATM options lose value fastest, and in 2025 plain weekly ATM buying lost Rs 50,296. The monthly ATM option with a profit lock was the best way to buy ATM.
ATM buying, 5m Shorter s5, one minute closing prices. Year columns in Rs thousand (k).
| Setup | Profit | Accuracy | Max DD | 2021* | 2022 | 2023 | 2024 | 2025 | 2026* |
|---|---|---|---|---|---|---|---|---|---|
| Weekly ATM, no exit rule | 1,66,545 | 29.4% | −90,130 | 49.1k | 43.9k | 35.9k | −0.9k | −50.3k | 88.8k |
| Weekly ATM, lock +30 pts, keep 50% | 2,91,282 | 37.2% | −95,975 | 53.8k | 104.9k | 37.7k | 28.2k | −10.7k | 77.5k |
| Weekly ATM, points trail start 30, trail 15 | 2,25,106 | 37.4% | −47,440 | 34.7k | 70.8k | 5.1k | −7.7k | 31.0k | 91.2k |
| Monthly ATM, no exit rule | 2,44,093 | 32.2% | −73,123 | 55.9k | 62.3k | 33.5k | −4.9k | 22.9k | 74.4k |
| Monthly ATM, lock +30 pts, keep 50% | 2,94,948 | 39.1% | −67,625 | 56.7k | 75.5k | 40.8k | 16.3k | 49.9k | 55.8k |
| Monthly ATM, +125 pts target, no SL | 3,40,026 | 32.4% | −68,891 | 50.1k | 77.6k | 42.8k | −2.6k | 53.2k | 119.0k |
* 2021 from 11 October; 2026 to 9 November. Source: Arko's Strategy Research. Hypothetical backtest, Nifty 50 index options, 11 Oct 2021 to 9 Nov 2026, 1 lot, statutory costs, zero brokerage, 1 tick slippage per order. All amounts in Rs. Accuracy = trades profitable before costs.
Monthly ATM with a +30 point lock that keeps 50% of the best profit earned Rs 2,94,948 at 39.1% accuracy and beat plain monthly ATM in 5 of 6 years. Every reentry rule made ATM results worse. Even so, buying by premium (Rs 250) earned about 1.8 times as much at a similar drawdown.
Accuracy versus profit
Accuracy for buying is naturally low: the best setups won 32% to 35% of trades. Average wins were more than twice the average loss, which is what made them profitable. Accuracy can be raised by taking profits early, but every step up in accuracy gave away profit, because the rare large winners were cut short.
Highest accuracy setups.
| Setup | Accuracy | Profit | Max DD | Avg win | Avg loss | Profitable every year |
|---|---|---|---|---|---|---|
| 30m Lengthy s3, premium ≥ 200, lock +10 pts keep 60% | 85.9% | 1,51,186 | −53,859 | 996 | −4,037 | No |
| 30m Shorter s1, premium ≥ 250, points trail 30 / 20 | 73.3% | 1,60,628 | −57,349 | 2,147 | −4,878 | Yes |
| 30m Shorter s10, premium ≥ 250, points trail 30 / 15 | 68.2% | 2,29,552 | −45,893 | 2,532 | −4,143 | Yes |
| 3m Lengthy s7, premium ≥ 200, lock 10 / keep 50%, 15 minute reentry | 65.9% | 2,98,216 | −79,687 | 954 | −1,633 | Yes |
| 5m Shorter s5, premium ≥ 200, lock 10 / keep 40%, 15 minute reentry | 62.8% | 2,90,062 | −71,954 | 1,015 | −1,482 | Yes |
| 5m Shorter s5, premium ≥ 250, +200 pts, SL 25% (best profit) | 35.0% | 5,28,599 | −71,915 | 3,421 | −1,528 | Yes |
Source: Arko's Strategy Research. Hypothetical backtest, Nifty 50 index options, 11 Oct 2021 to 9 Nov 2026, 1 lot, statutory costs, zero brokerage, 1 tick slippage per order. All amounts in Rs. Accuracy = trades profitable before costs. Lock and trail rows use one minute closes; the last row uses high/low fills.
- The highest accuracy found was 85.9% (30 minute Lengthy Strength 3 with a +10 point lock), but it earned only Rs 1.5 lakh and lost money in 2021: small profits were booked often while losers ran to the full stop.
- The highest accuracy that was profitable in every year was 73.3% (30 minute Shorter Strength 1, points trail), earning Rs 1,60,628.
- The best balance of accuracy and profit was the 5 minute profit lock with a 15 minute reentry: 62.8% accuracy and Rs 2,90,062. It traded about 4,900 times, so it was the most sensitive to slippage.
- For an option buyer, the report treats profit and drawdown, not accuracy, as the measures that matter.
Year by year
Profit for the leading setups and the baseline, five year totals before and after costs; year columns after costs, in Rs thousand (k).
| Profile | Setup | Before costs | After costs | Accuracy | Max DD | 2021* | 2022 | 2023 | 2024 | 2025 | 2026* |
|---|---|---|---|---|---|---|---|---|---|---|---|
| 1. Highest profit | 5m Shorter s5, premium ≥ 250, target +200 pts, SL 25% | 6,11,144 | 5,28,599 | 35.0% | −71,915 | 72.6k | 96.0k | 71.3k | 66.6k | 85.9k | 136.2k |
| 2. Slower chart | 15m Shorter s1, premium ≥ 200, target +250 pts, SL 25% | 5,29,548 | 4,97,160 | 32.0% | −99,209 | 64.2k | 17.8k | 86.5k | 17.3k | 156.6k | 154.7k |
| 3. Close alternative | 5m Shorter s5, premium ≥ 200, target +225 pts, SL 25% | 5,58,623 | 4,92,159 | 34.2% | −73,131 | 62.1k | 88.4k | 55.4k | 54.2k | 99.9k | 132.1k |
| 4. Lowest drawdown | Monthly, 5m s5, premium ≥ 100, target +150%, SL 25% | 4,53,866 | 4,16,977 | 33.2% | −43,976 | 38.6k | 61.6k | 49.9k | 34.2k | 80.3k | 152.4k |
| 5. Steadiest | 3m Lengthy s7, premium ≥ 250, target +200 pts, SL 25% | 5,19,989 | 4,31,651 | 35.1% | −64,976 | 83.3k | 50.5k | 86.7k | 79.2k | 66.7k | 65.2k |
| 6. Higher accuracy | 5m s5, premium ≥ 200, lock 10 / keep 40%, 15 minute reentry | 4,10,754 | 2,90,062 | 62.8% | −71,954 | 67.7k | 84.4k | 47.6k | 10.5k | 7.4k | 72.5k |
| Reference | Baseline: 5m s5, premium ≥ 100, no exit rule | 3,11,020 | 2,76,234 | 31.1% | −68,852 | 53.4k | 60.6k | 62.3k | 10.4k | −21.9k | 111.4k |
* 2021 from 11 October; 2026 to 9 November. Source: Arko's Strategy Research. Hypothetical backtest, Nifty 50 index options, 11 Oct 2021 to 9 Nov 2026, 1 lot, statutory costs, zero brokerage, 1 tick slippage per order. All amounts in Rs. Accuracy = trades profitable before costs. Rows 1 to 5 use high/low fills; rows 6 and 7 use one minute closes.
Discussion
Why a fixed target worked for a buyer
An option buyer is paid by a few large moves. A target placed +200 to +250 points above entry sells into those spikes while they last. A trailing stop instead waits for the premium to fall from its high, giving back 30 to 50 points on every winner, and with only one winner in three that give back costs more than the trail saves. Profit locks raised accuracy to 38% to 45% but cut the winners short. Stops on their own added little: most losing trades were already ended by the strategy’s close signal before a wide stop was reached.
Why reentry rarely helped
Buying the same option again after a profit lock (after a 15 minute pause, after the premium moves 5 to 10 points above the exit, or after Nifty moves 20 points further) rarely beat locking without reentry. The reentries caught moves that were already fading, and time decay worked against every reentry.
Why same day exits lost
Closing every trade by 15:15 lost money on every timeframe; none of the four same day settings beat holding with no rule.
Setup profiles
The report describes five setups and what each is for. They show how each setup behaved in the backtest; they are not a recommendation to trade any of them.
| Profile | Setup | What stood out in the backtest |
|---|---|---|
| Highest profit | 5m Shorter s5, premium ≥ 250, target +200 pts, SL 25% | Highest profit, profitable every year, drawdown in line with the baseline |
| Slower chart | 15m Shorter s1, premium ≥ 200, target +250 pts, SL 25% | Half the number of trades, for traders who cannot watch a 5 minute chart; more uneven year to year |
| Lowest drawdown | Monthly, 5m s5, premium ≥ 100, target +150%, SL 25% | Lowest drawdown (about Rs 44,000) and slower time decay; profit concentrated in 2025 and 2026 |
| Steadiest | 3m Lengthy s7, premium ≥ 250, target +200 pts, SL 25% | The steadiest year by year profile, on a faster chart |
| Higher accuracy | 5m s5, premium ≥ 200, lock 10 / keep 40%, 15 minute reentry | Won six trades in ten, for traders who find long losing streaks hard to follow; earned about 45% less and needs low slippage execution |
How a trade ran under the highest profit setup
- Signal. Arko’s Strategy on the 5 minute Nifty chart (Shorter Closing, Strength 5) gives a Buy or Sell signal.
- Strike. The backtest bought the call (Buy) or put (Sell) of the nearest weekly expiry whose premium was the lowest at or above Rs 250.
- Orders. A limit sell was placed at entry + 200 points (target) and a stop loss sell at 75% of the entry price (25% stop), modelled as a bracket or OCO order so that one cancels the other.
- Exit. The trade ended at the first of: target, stop, or the strategy’s close or opposite signal. On an opposite signal the open orders were cancelled and the other side was bought.
- Overnight. If none of these had happened the position was held overnight; at expiry it rolled to the next weekly contract with fresh target and stop orders.
- What to expect. About one trade in three was a winner; losing streaks of 15 trades occurred in the test, and the maximum drawdown was about Rs 72,000 per lot.
Limitations
- Order types. The study models the target as a resting limit order and the stop as a stop loss order, ideally stop limit with a wide limit, so a fast market does not leave the position unprotected.
- Costs. Results assume zero brokerage. At Rs 20 per order the highest profit setup would pay about Rs 1.15 lakh more over five years (2,871 trades x 2 orders x Rs 20).
- Lot size. The Nifty lot size changed several times during the period; results use the lot size in force on each trade date, so rupee results per year are not exactly comparable.
- Data. Option prices are one minute prices. Fills inside a minute were modelled conservatively, but real fills in illiquid strikes or around news can be worse.
- Fitting. The best settings were chosen after looking at the full period. The risk of overfitting was reduced by requiring every year and both halves to be profitable, by checking neighbouring settings and by stress testing slippage, but future results will differ.
- Scope. This report covers Nifty only. Bank Nifty, Fin Nifty, Midcap Nifty and Sensex were not part of this study.
Glossary
| Term | Meaning |
|---|---|
| 5m Shorter s5 | Shorthand for a signal setting: 5 minute chart, Shorter Closing mode, Strength 5. Lengthy is the other closing mode. |
| Premium ≥ 250 | The strike rule: buy the cheapest option whose premium is at least Rs 250 at entry. |
| ATM, ITM | At the money (the strike nearest to Nifty) and in the money. ITM1 to ITM3 are one to three strikes in the money. |
| CE, PE | Call option and put option. |
| Target, SL | A sell at a set profit, in points or percent of premium; and a stop loss, a sell when the premium falls by a set percent. |
| Trailing stop | An exit rule that follows the premium’s high and sells on a fall of a set size. |
| Profit lock | An exit rule that sells when the premium gives back more than a set share of the best open profit. |
| Reentry | Buying the same option again after a profit lock exit when a condition is met. |
| Closing price fills, high/low fills | Exits checked on each minute’s closing price only, or against each minute’s high and low. |
| Accuracy | The share of trades profitable before costs (after costs in the grid search tables). |
| Max drawdown (DD) | The largest fall of cumulative profit from a previous peak. |
| k, lakh | Rs thousand and Rs 1,00,000. |
| Tick, slippage | The minimum price step (Rs 0.05), and the assumed adverse fill on each order. |
FAQ
Are these real trading results?
No. All figures are hypothetical backtest results computed on historical one minute option prices with modelled fills and costs. They do not represent actual trading, and no representation is made that any account will achieve similar results.
Is this a recommendation to buy options?
No. The report is published for education and research only. It is not investment advice, a solicitation, or a recommendation to buy or sell any security. Option buyers can lose the whole premium paid. Consult a SEBI registered investment adviser before trading.
Does the report show how Arko’s Strategy creates its signals?
No. The signal logic is proprietary. The study holds the signals fixed and only looks at the chart setting, the option bought and how the trade is closed.
Can I read the full report?
Yes. Download the full report (AS-RR-2026-02, PDF). The PDF (11 Nov 2026) uses the same data as this page, to 9 Nov 2026. Like this page, it is a hypothetical backtest on past data, not investment advice.